All articles with 'form controls' Tag

Ok people. Let me tell you that this post is almost not about Excel. It is about how one Excel blogger’s (yours truly) dream of long distance cycling came true. So sit back, grab your favorite drink and read between sips.
So what is this all about?
Last Sunday (27th July) & Monday (28th), I finished my first ever 200KM bicycle ride. I rode for a little more than 12 hours, burned 5,179 calories & rode 206 kilometers.
It is definitely one of the most memorable, tiresome & uplifting experiences in my life. So naturally, I want to share the story with you.
Continue »CP011: 5 Excel magic tricks to impress your boss
Podcast: Play in new window | Download
Subscribe: Apple Podcasts | Spotify | RSS
If you want to create magical effect with your Excel workbook (or report, dashboard, model), then hear no further. In this episode, we explore 5 very powerful magic tricks you can apply to get jaw dropping reactions from your bosses, clients & colleagues.
In this podcast, you will learn,
- Annoucements
- Why magic
- 5 Excel Magic Tricks
- 1: Conditional formatting
- 2: Form controls + Charts
- 3: Pivot tables + Slicers
- 4: Macros + Automation
- 5: Using right feature @ right time
- How to learn these magic tricks
- Conclusions
Hello everyone. Stop reading further and go fetch your helmet. Because what lies ahead is mind-blowingly awesome.
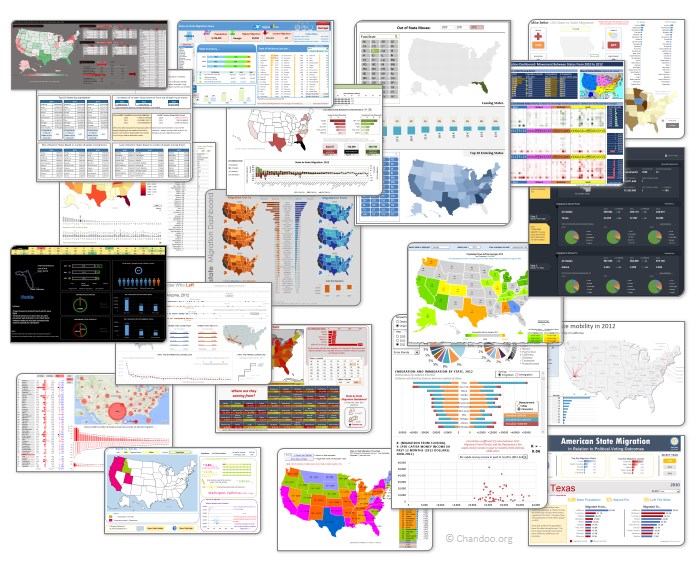
About a month and half ago, we held our annual dashboard contest. This time the theme is to visualize state to state migration in USA. You can find the contest data-set & details here.
We received 49 outstanding entries for this. Most of the entries are truly inspiring. They are loaded with powerful analysis, stunning visualizations, amazing display of Excel skill and design finesse. It took me almost 2 weeks to process the results and present them here.
Click on the image to see the entries.
Continue »Modeling tiles in a room using Excel Conditional Formatting
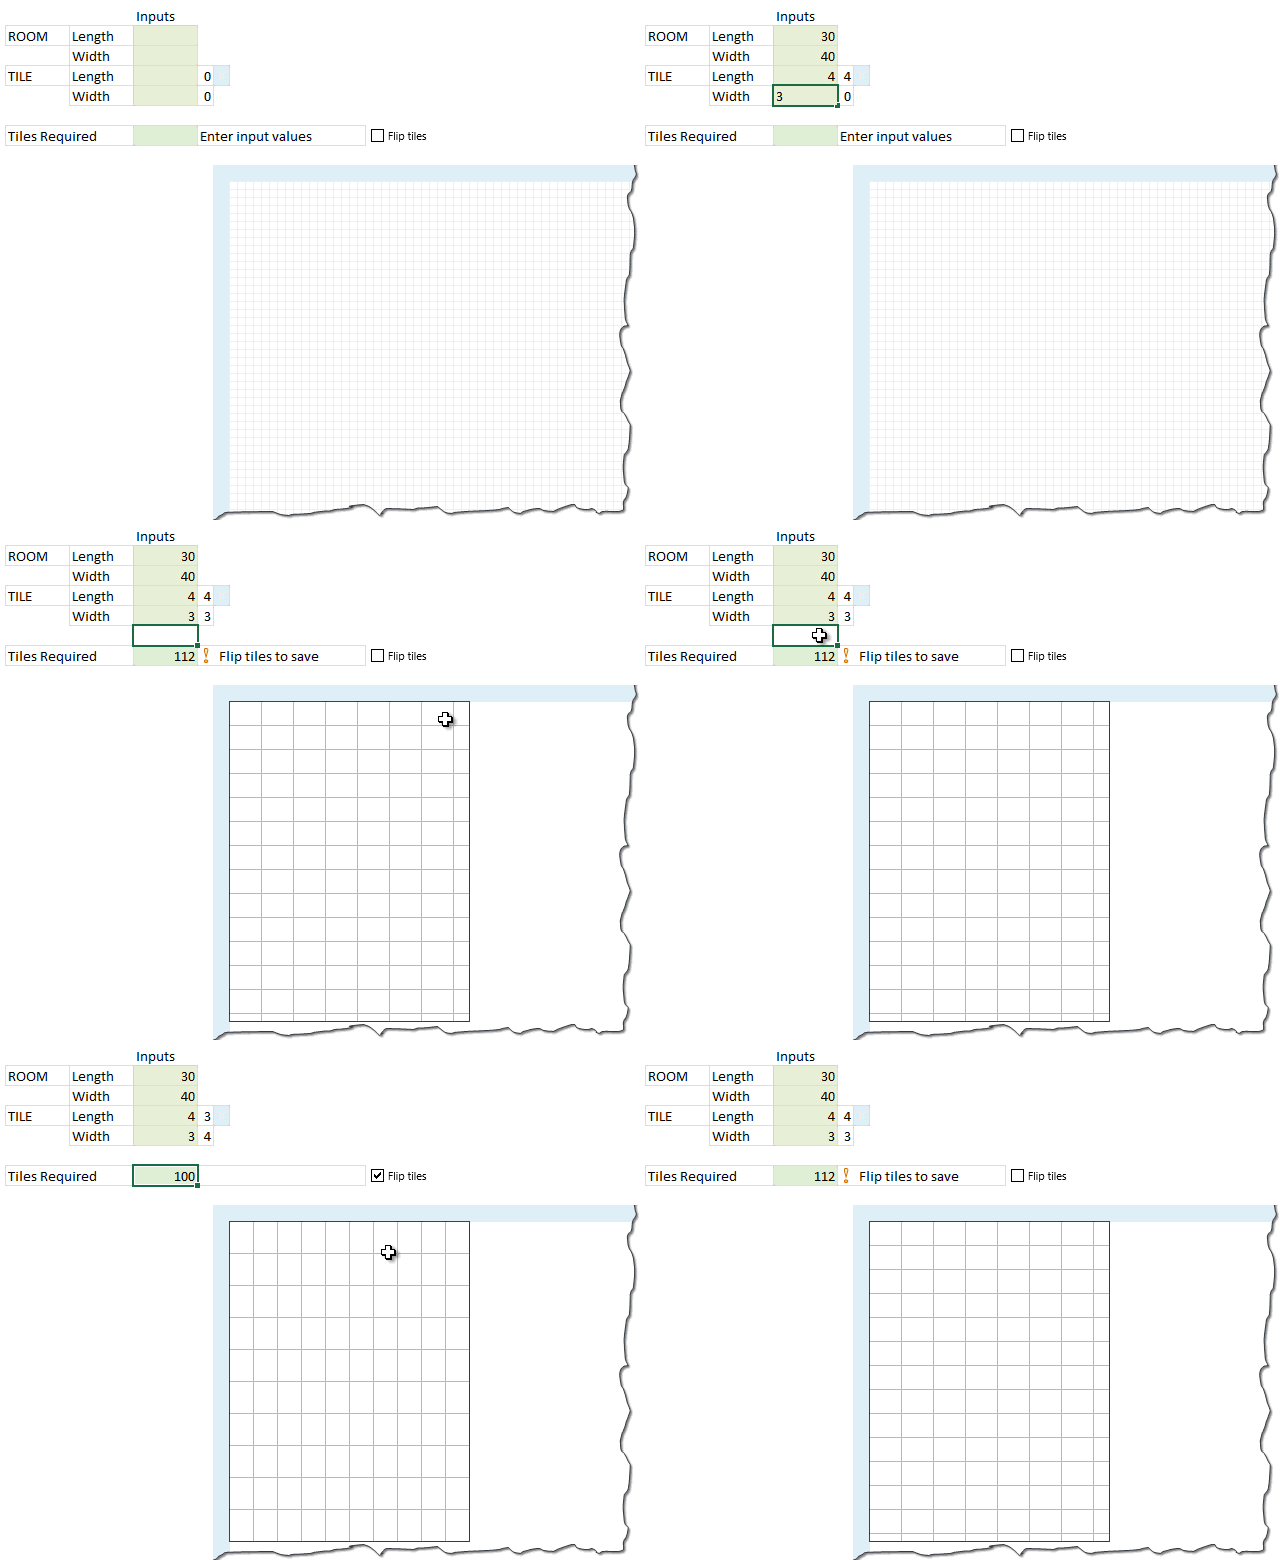
Last week we learned how to answer questions like, “How many tiles in a room?” using Excel. We learned about CONVERT function and fraction number format settings in Excel.
But why stop at calculation? We can even model a room full of tiles, thanks to Excel’s grid nature.
So today, we will learn how to create a room layout as shown above, using Excel.
Continue »There are Easter Eggs in this Excel file!!!

Hello Friends…,
It is Easter time again. Every year, we at Chandoo.org celebrate Easter by hunting for eggs (not in the wild, just in the Excel workbooks). This year too I have hidden 30 Excel tips in a workbook. You have to solve 3 puzzles to find them. So what are you waiting for. Go ahead and hunt for them eggs.
Click here to download the Easter eggs file.
I am sure you will enjoy them 🙂
Continue »CP005: Introduction to Form Controls – an interview with Debra Dalgleish
Podcast: Play in new window | Download
Subscribe: Apple Podcasts | Spotify | RSS
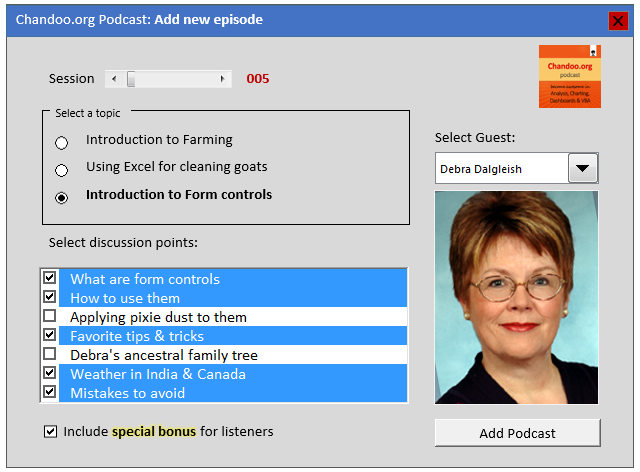
In the 5th session of Chandoo.org podcast, we are going to demystify form controls.
I am very happy and excited to interview my good friend, fellow Excel MVP, author, blogger and virtual mentor – Debra Dalgleish about this topic.
In this podcast, you will learn,
- What are form controls
- When you would use them?
- Example form control – Combo box
- How form controls differ from active-x controls
- How to enable form controls in your Excel?
- Various important form controls
- Special bonus & how to obtain it
Top 10 things I learned using Excel for a decade

Sometime during the 2nd half of 2013, I finished 10 years of Excel usage. In the last 10 years, I completed my studies, got my first job, married, had kids, visited 15 different countries, quit my job to start a business, bought first car, first house, made dozens of new friends, read 100s of books, wrote a book and learned 1000s of new things. And all along, Excel stayed a true companion. Right from MBA entrance exam preparation in 2003 to making my summer internship project reports in 2005 to planning my wedding expenses in 2007 to getting a promotion in 2009 to planning my kids feeding schedule in 2010 to running a successful business in 2014, Excel helped me in every step.
So today, I want to tell you the top 10 things I learned using Excel in last decade. Grab a hot cup of coffee, buckle your belts and get ready for time travel.
Continue »Closing gaps in this Gender Equality Gap chart…
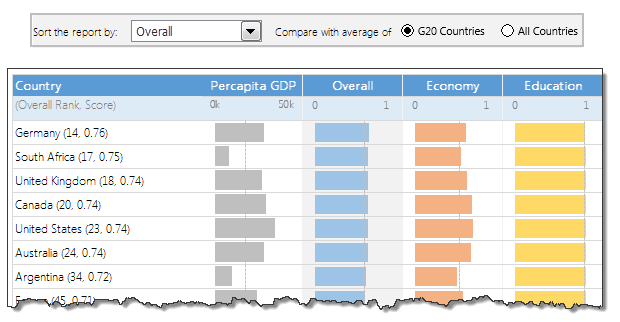
Today lets close some gaps.
Recently I saw this interesting chart on Economist Daily Charts page. This chart is based on World Economic Forum’s survey on how women compare to men in terms of various development parameters. First take a look at the chart prepared by Economist team.
So what are the gaps in this chart?
This chart fails to communicate because,
- All country charts look same, thus making it difficult to spot any deviations.
- We cannot quickly compare one country with another on any particular indicator.
- It does not provide a better context (for eg. how did these countries perform last year?)
But criticizing someone’s work is not awesome. Fixing it and making an even better chart, that has awesome written all over it. So that is what we are going to do. You can see the improved chart above. Click on it to learn how you can create it.
Continue »Last day for enrollments – Join our Power Pivot class & become awesome analyst
I have a quick announcement & a creative dashboard to share with you. First the announcement.
Only few hours left to join our Power Pivot course…
As you may know, I have opened enrollments for our 2nd batch of Power Pivot course few days ago. The aim of this course is to make you awesome in Excel, Advanced Excel, Dashboards, Power Pivot & Advanced Power Pivot.
We will be closing the doors of this program at midnight, today (11:59 PM, Pacific time, Friday, 16th of August).
If you want to join us, click here and enroll now.
Continue »How to create a Then vs. Now interactive chart in Excel?
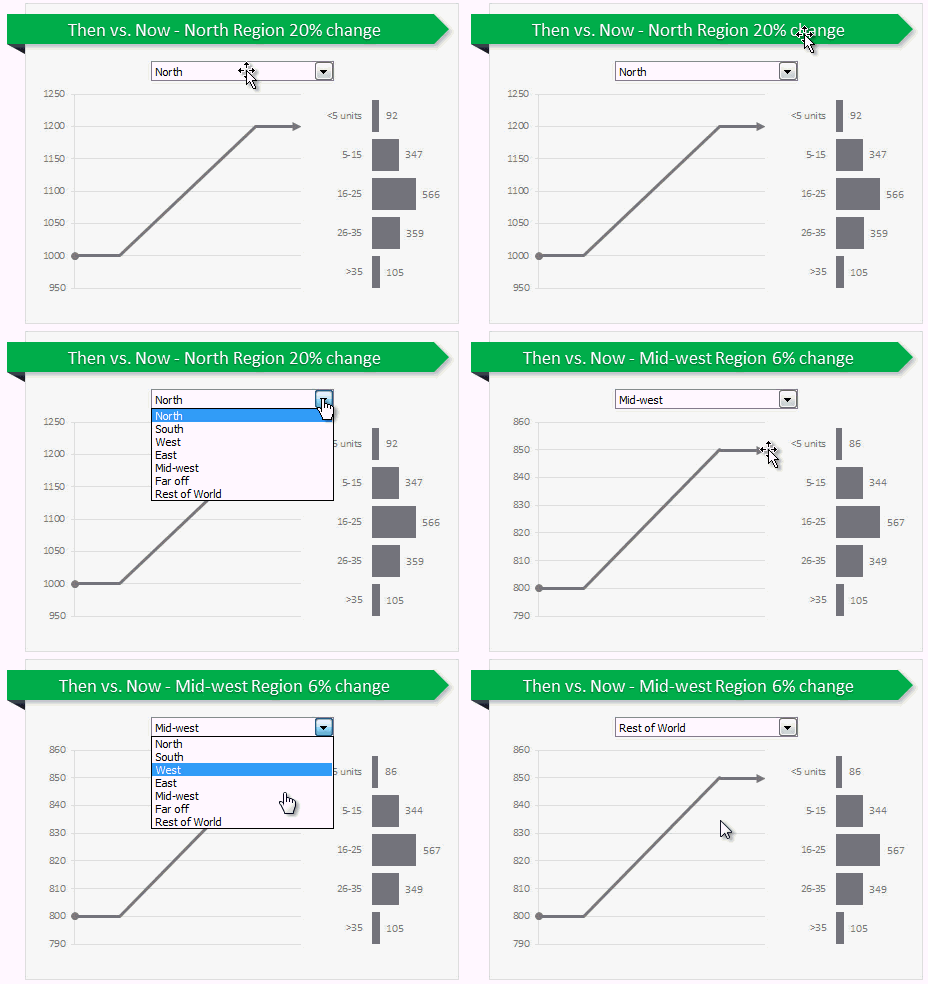
You have been there before.
Trying to compare last year numbers with this year, or last quarter with this quarter.
Today, let us learn how to create an interactive to chart to understand then vs. now.
Demo of Then vs. Now interactive chart
First, take a look the completed chart below. This is what you will be creating.
Continue »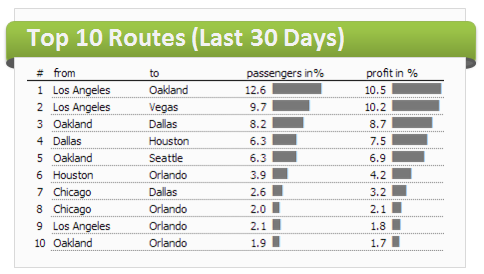
As the launch date for our 2nd batch of Power Pivot class nears, my plate looks fuller than ever. Fine tuning the course details, preparing our online classroom for new batch of students and coordinating with Rob for video recording etc.
But I wanted to take a few mins today and share with you some really useful Excel tricks, ideas and examples from web. I found these really useful and inspiring. I am sure you will learn from these links as much as I learned.
Continue »Are you ready for 2,000 miles, 15 days & 10 Excel tips road trip?

Finally my Excel classes in USA are over. It was a lot of fun traveling to new cities, teaching Excel & dashboards to enthusiastic crowds and making new friends. As if that is not fun enough, we (Jo, kids & I) are going on a 2,000 mile, 2 week road trip starting today.
Although I am enjoying all this, I also feel bad for not taking enough time to share new tricks, ideas & techniques with you here. So, I have a wacky, wild & awesome plan for you. Join us on our road trip.
That is right. You can join me on our road trip and see what I see, learn some pretty cool Excel tricks, all while sipping coffee and stretching legs in the comfort of your office cubicle.
Continue »How to create an Interactive Chart in Excel? [Tutorial]
![How to create an Interactive Chart in Excel? [Tutorial]](https://cache2.chandoo.org/images/c/interactive-chart-in-excel-demo.gif)
Imagine you have a worksheet with lots of charts. And you want to make it look awesome & clean.
Solution?
Simple, create an interactive chart so that your users can pick one of many charts and see them.
Today let us understand how to create an interactive chart using Excel.
Continue »
Last week, we had a lovely poll on what are your favorite features of Excel? More than 120 people responded to it with various answers. So I did what any data analyst worth his salt would do,
I analyzed the data and here are the top 10 features in Excel according to you.
Read on to learn more.
Continue »There is an Easter egg in this chart!
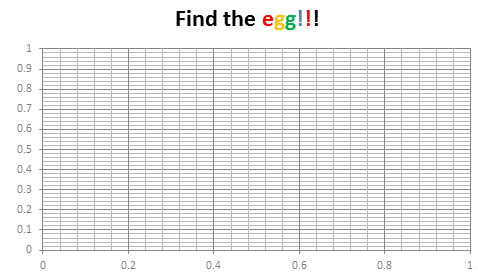
Do not worry, you are not time traveling or seeing things. Its just that, this year I have decided to publish our Easter Egg a few days early.
And oh, I have 3 reasons for it:
- 2 of my favorite festivals – Easter & Holi (a festival of colors, celebrated in India) are this week. Holi is today (Wednesday) & Easter on Sunday.
- My kids are super excited about Holi as this is the first time they will be playing it. So we have family time from today until Wednesday and I do not feel like writing a blog entry on Friday 🙂
- I like to have 3 reasons for everything.
Hence the Easter Egg is advanced a few days. But it is just as fun (or may be better) as previous Easter eggs.
Continue »
