A better chart to visualize “Best places to live” – Top 100 cities comparison Excel chart
Recently, I saw this chart on Economist website.
It is trying to depict how various cities rank on livability index and how they compare to previous ranking (2014 vs 2009).
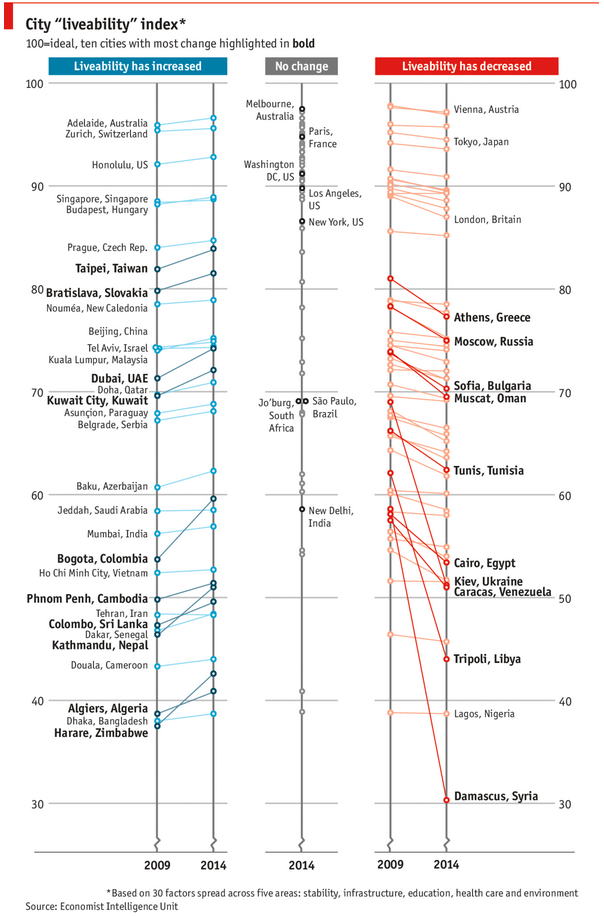
As you can see, this chart is not the best way to visualize “Best places to live”.
Few reasons why,
- The segregated views (blue, gray & red) make it hard to look for a specific city or region
- The zig-zag lines look good, but incredibly hard to understand % changes (or absolute changes)
- Labels are all over the place, thus making data interpretation hard.
- Some points have no labels (or ambiguous labels) leading to further confusion.
After examining the chart long & hard, I got thinking.
Its no fun criticizing someones work. Creating a better chart from this data, now thats awesome.
Story of my first ever 200KM bike ride (plus an Excel dashboard with ride stats)

Ok people. Let me tell you that this post is almost not about Excel. It is about how one Excel blogger’s (yours truly) dream of long distance cycling came true. So sit back, grab your favorite drink and read between sips.
So what is this all about?
Last Sunday (27th July) & Monday (28th), I finished my first ever 200KM bicycle ride. I rode for a little more than 12 hours, burned 5,179 calories & rode 206 kilometers.
It is definitely one of the most memorable, tiresome & uplifting experiences in my life. So naturally, I want to share the story with you.
CP011: 5 Excel magic tricks to impress your boss
Podcast: Play in new window | Download
Subscribe: Apple Podcasts | Spotify | RSS
If you want to create magical effect with your Excel workbook (or report, dashboard, model), then hear no further. In this episode, we explore 5 very powerful magic tricks you can apply to get jaw dropping reactions from your bosses, clients & colleagues.
In this podcast, you will learn,
- Annoucements
- Why magic
- 5 Excel Magic Tricks
- 1: Conditional formatting
- 2: Form controls + Charts
- 3: Pivot tables + Slicers
- 4: Macros + Automation
- 5: Using right feature @ right time
- How to learn these magic tricks
- Conclusions
Excel Dashboards – 49 dashboards to visualize US State to State migration trends
Hello everyone. Stop reading further and go fetch your helmet. Because what lies ahead is mind-blowingly awesome.
About a month and half ago, we held our annual dashboard contest. This time the theme is to visualize state to state migration in USA. You can find the contest data-set & details here.
We received 49 outstanding entries for this. Most of the entries are truly inspiring. They are loaded with powerful analysis, stunning visualizations, amazing display of Excel skill and design finesse. It took me almost 2 weeks to process the results and present them here.
![]()
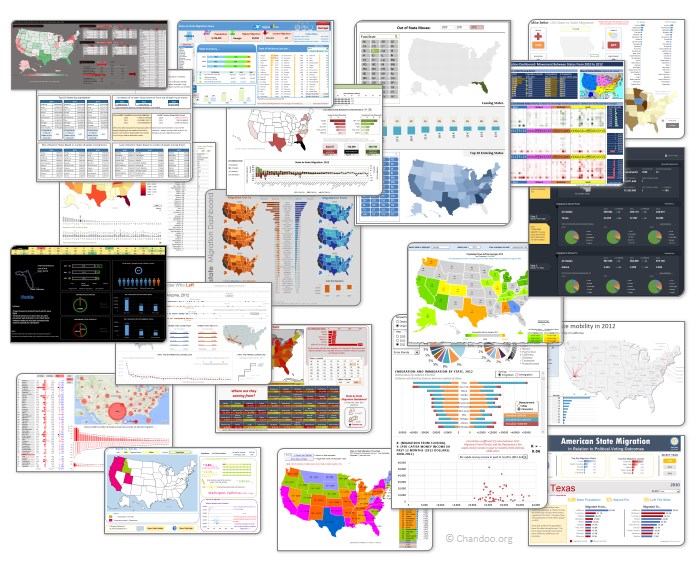
Click on the image to see the entries.
Modeling tiles in a room using Excel Conditional Formatting
Last week we learned how to answer questions like, “How many tiles in a room?” using Excel. We learned about CONVERT function and fraction number format settings in Excel.
But why stop at calculation? We can even model a room full of tiles, thanks to Excel’s grid nature.
So today, we will learn how to create a room layout as shown above, using Excel.
There are Easter Eggs in this Excel file!!!
Hello Friends…,
It is Easter time again. Every year, we at Chandoo.org celebrate Easter by hunting for eggs (not in the wild, just in the Excel workbooks). This year too I have hidden 30 Excel tips in a workbook. You have to solve 3 puzzles to find them. So what are you waiting for. Go ahead and hunt for them eggs.
Click here to download the Easter eggs file.
I am sure you will enjoy them 🙂
CP005: Introduction to Form Controls – an interview with Debra Dalgleish
Podcast: Play in new window | Download
Subscribe: Apple Podcasts | Spotify | RSS
In the 5th session of Chandoo.org podcast, we are going to demystify form controls.
I am very happy and excited to interview my good friend, fellow Excel MVP, author, blogger and virtual mentor – Debra Dalgleish about this topic.
In this podcast, you will learn,
- What are form controls
- When you would use them?
- Example form control – Combo box
- How form controls differ from active-x controls
- How to enable form controls in your Excel?
- Various important form controls
- Special bonus & how to obtain it