
This is the age of big data. Alas, what we need is big insights, not big data. Unfortunately, finding even small insights buried in heaps of data is hard. And as analysts & managers, we are expected to spot trends before they are obvious, raise red flags early on and prompt action backed by solid insights. But how?
The challenge is complicated due to,
- we have too much data
- too many buzz words (big data, data science, business intelligence, predictive analytics etc.) but no instruction on how to do
- everyone (customers, bosses, regulatory authorities etc.) expect us rely on data to take actions
- the results are expected NOW, not after 6 weeks of analysis
The answer is obvious. We need to analyze data in agile fashion and derive results that prompt us towards better decisions.
What we need is not the answer. We need the solution.
A solution to help you take any raw data and uncover the story it is hiding. This is where 50 ways to analyze data course can help you.
Here is one question you should not be afraid to hear.
“Can you analyze this data and tell me what is going on?”
Time for a short story from my past. Rewind to June 2006. Right after my MBA, I became a business analyst with one of the largest technology companies in world. Everything was smooth until my first assignment. My boss called me to her cabin and said, “Can you analyze our top 100 clients and tell me what you find?”
It was the kind of open ended question that has many answers. And I knew none. After several days of frantic analysis (in Excel, of course), I came up with several charts only to be shot down. It is as if I am shooting in dark and hoping to hit the insight my boss wanted.
Only when I applied structured thinking and proper analysis did I find the right insights that helped us take better decisions.
After 13 years, 1,000s of spreadsheets later, I am very happy to create a detailed program to help you attack such opened ended questions confidently.
As the name suggests, 50 ways to analyze data contains 50 video lessons, each exploring one analysis technique or situation.
You can consume these lessons in any order. The only requirement is that you should be good with Excel. If you are a beginner, I suggest enrolling for the option – Advanced Excel + 50 Ways course package.Let’s see the lesson plan.General Analysis techniques (25 lessons):
- Moving averages
- Weighted averages
- Top 5 / bottom 5 analysis (2 lessons)
- Trend analysis (4 lessons)
- Descriptive statistics
- Visual analysis of distribution (2 lessons)
- Budget vs. Actual analysis (3 lessons)
- How many items are due?
- Overlapping dates & times
- Monthly totals from daily data
- Quarterly totals & reporting from data (2 lessons)
- Unique & duplicate data analysis
- Panel charts
- XY Relationship analysis & charts
- Indexed charts
- Word frequency & sentiment analysis
Marketing & Operations analysis techniques (11 lessons):
- Pareto analysis & charting
- Us vs. competition analysis & charts
- Solver & optimization techniques (2 lessons)
- Planning a project
- FIFO inventory analysis
- BCG matrix analysis
- Random allocation & scheduling (2 lessons)
- Analytical charts
- Segmentation & Cluster analysis using K-means technique
- Finding outliers using K Nearest Neighbors technique
Financial analysis techniques (8 lessons):
- Break-even analysis
- Buy vs. Rent analysis
- Time value of money
- Cost benefit analysis
- 2 way data tables & what if analysis
- Internal rate of return
- Circular calculations & scenarios
- Simulation using Data tables
Case studies (6 lessons):
- Case studies on detailed analysis reports, dashboards & articles featured on chandoo.org hall of fame.
Bonus material:
- Introduction to Excel
- Techniques on working with raw data (clean up techniques, connecting to external databases)
- Example workbooks for each lesson
- Bonus: Cust. complaints case ($99 value)
- Uber vs. Your Car – Bonus Model & Video
- Forecasting time series data – interactive chart – XLS & Video
Lessons for Advanced Excel (Excel School) module:
This is an optional module you can sign-up for. It includes 32 hours of training on beginner to advanced Excel concepts and dashboard reporting. This module has below lessons:
- Excel basics – 3 lessons
- Excel formulas – 11 lessons
- Advanced formulas – 7 lessons
- Formatting & presentation of data – 3 lessons
- Conditional formatting – 3 lessons
- Excel charting basics – 4 lessons
- Advanced charting in Excel – 2 lessons
- Interactive & dynamic charts in Excel -2 lessons
- Using data validation, sorting & filtering features –
- Excel Pivot tables – 2 lessons
- Working with external data – 5 lessons
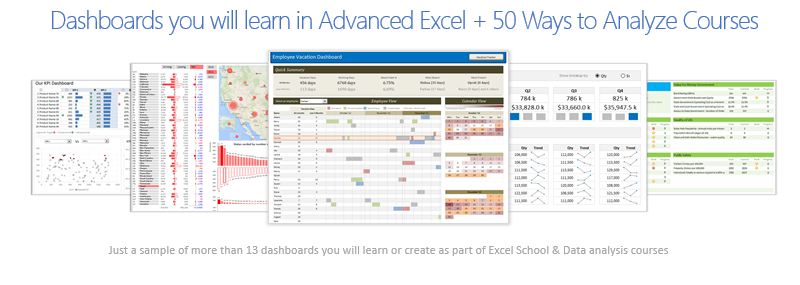
- Excel Dashboards – 12 lessons

In the 50 ways to analyze data course:
- How to analyze data & present results
- How to model & solve business problems
- Multiple approaches to analyze data
- Creating interactive analysis outputs
- Core analysis concepts on statistics, operations & finance
- Obtaining, cleaning & structuring data for analysis
- Speeding up analysis process
- Making your analysis flexible & easy to change
- Simulations and what-if analysis
In the Advanced Excel & Dashboards module:
- Using Excel faster & better
- Creatively using & combining Excel formulas
- Making awesome workbooks
- Creating stunning visualizations & interactive charts
- Bringing outside data to Excel for analysis
- Unlocking the mysteries of Pivot Tables
- Preparing amazing dashboard reports & automating them
- Becoming productive in Excel
Watch below video to understand how this type of analysis is conducted.Download Cost Benefit Analysis WorkbookClick here to download the workbook for cost benefit analysis.Read companion articleIf you want more notes or explanation about this analysis technique, read this companion article.
Very simple.
(1) Choose your course options and sign-up
(2) We will email your login credentials
(3) Login to online classroom
(4) Start learning (lessons are available 24×7, watch them anytime you want)
(5) Download example workbooks and practice
(6) Become awesome in Excel & Data analysis
Please keep these dates in mind when joining the 50 ways class.Enrollments open – Now
Classes begin: As soon as you enroll.For those joining Excel School combination:
All the content is already published. Please start Excel School first. Once you finish the program, then go for 50 ways material.
|
50 Ways Course What do you get? 20 hours of data analysis training All for just $247 |
Excel School + 50 Ways Course
Over 50 hours of training All for just $447 |


– John Geiger
Q. Which version of Excel do I need?
I am using Excel 365 / Excel 2016 / 2013 to demonstrate all the techniques. You can enjoy this class with Excel 2007, Excel 2010, Excel 2013, Excel 2016, Office 365, Excel 2019, Excel 2011 for Mac, Excel 2014 for Mac.
Q. I am an Excel newbie / intermediate level user, which course should I take?
Go for either Excel School or Excel School + 50 ways course. Do not enroll in 50 ways course with out strong foundation in Excel.
Q. Can I upgrade to other courses after enrolling?
Yes. Just pay $247 to upgrade to Excel School program anytime.
Q. Do you have discounts for team enrollments?
Oh yes, we have. Visit team discounts page to know more & enroll with discounted prices.
2. The topics covered are exhaustive
3. Practical examples are taken from various industry
4. There is index on the start of every chapter for the topics covered
5. I received revert for few of my queries and that helped me in my job
6. The download of chapter can be a ready reference for life long
7. The reference website give for more exploration helped to get detail knowledge on topic
-Shrikant K
If you have any problem during signup process or still have some un-answered questions, write to me at chandoo.d@gmail.com or call me at +1 206 792 9480 or +64 21 070 1136. I will be very glad to answer your questions.
I am looking forward to making you awesome in data analytics & advanced Excel.