
Excel pivot tables are very useful and powerful feature of MS Excel. They can be used to summarize, analyze, explore and present your data. In this page, you can learn about Excel Pivot Tables, How to use them, Examples Pivot Table Reports & More.
Excel Pivot Table Topics:
In this guide, you can learn the following topics. Click on relevant link to access the information.
1. What is a Pivot Table?
2. How to Create a Pivot Table in Excel?
3. Pivot Tables – Top 5 Tips & Tricks
4. Advanced Pivot Table Techniques
1. Grouping Data in Pivot Reports
2. Using Report Filters
3. Using Pivot Table Slicers
5. More Pivot Table Examples & Techniques
6. Training Programs on Pivot Tables
7. Books on Pivot Tables
8. Additional Resources on Excel Pivot Tables
What is a Pivot Table?
Excel Pivot Tables help you take a table (or list) of data and then create a report from it, instantly.
For eg. you can take a bunch of sales data and then create a report on region-wise sales performance by Product.

How to Create a Pivot Table in Excel?
 Creating a pivot table in Excel is very simple. Just follow these steps.
- Arrange your data in a table like fashion. Make sure there are no blank rows.
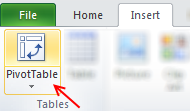
- Select your data and goto Insert > Pivot from Ribbon (or press ALT+DP)
Read this tutorial to learn how to create pivot reports.
Video Tutorials on Pivot Tables
You can see a tutorial on pivot tables on the top of this page (to the right). You can see the tutorial here too.
Top 5 Tips on Pivot Tables
 You can do a lot of reporting & analysis using Pivot Tables. Keep these 5 tips in mind next time you are using Pivot Tables. Click on the links to view the tip in detail.
- Drill down pivot tables: You can drill-down and get details by just double clicking on a value.
- Change Summary from Total: You can change summaries in Pivot Reports from Total to Count, Average or something else very easily. Just use Value Field settings.
- Slice & Dice Pivots: You can move anything to anywhere in pivot reports and Excel would instantly change the report layout and calculations.
- Difference from last month: You can easily display the difference from last month by changing value field settings.
- Calculated Fields in Pivots: You can make custom calculations in Pivot Reports by adding adding calculated fields.
Click here to read all these tips in detail.
Advanced Pivot Table Techniques
There are many things we can do with Pivot Tables to analyze data or do complex reporting. Go thru these advanced pivot table techniques to learn more.
Create Monthly, Quarterly or Yearly reports from Daily Data:
Using “Group” feature of Excel, you can easily create monthly or quarterly reports from daily data. Or, create show summaries by hour from a transaction data etc. The possibilities are many.

Learn more about grouping dates in pivot reports.
Use Report Filters to Create Many Reports from Same Data
We can use report filters feature of Excel Pivot Tables to create multiple reports from same data in just a few clicks.
Learn more about pivot table report filters.
Use Slicers to create interactive dashboards in Excel
In Excel 2010, Microsoft has introduced a feature called as slicers. Think of slicers as filters, only more visual. So, if you add a slicer for department, you would see the list of all departments in box. You can just click on “marketing” to see the report for that department alone. We can use this feature to create an interactive dashboard in Excel, like below.
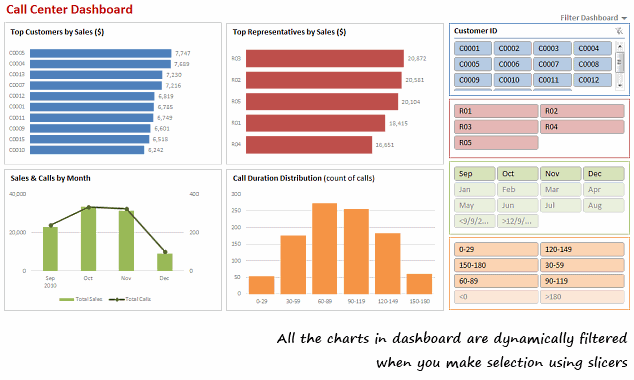
Learn more about Slicers & using them to create dashboards.
More Examples on Pivot Tables & Pivot Charts
Go thru these articles to learn more about various advanced pivot table techniques.
- Show top 10 values using Pivot Tables
- Remove Duplicates & Sort Lists of data using Pivot Tables
- Doing Profit & Loss Reporting using Excel Pivot Tables – 6 part tutorial
- How to analyze sales data using Pivot Reports – Case Study
- More on Pivot Tables
Recommended Training Programs on Pivot Tables
I conduct an online training program called as Excel School. In that, we have 23 hours of video instruction on various aspects of Excel. We dedicate more than 2.5 hours of that training to Excel Pivot Tables. If you wish to learn how to use Pivot Tables and various other important features of Excel, then consider joining this program. It is very well designed with lots of practical examples & tips. You can download practice workbooks to instantly learn everything from Formulas, Conditional Formatting, Pivot Tables & Charts etc.
Click here to learn more about Excel School program.
Recommended Books on Excel Pivot Tables
There are quite a few very useful books on Pivot Tables. I recommend the below 4 books if you want to learn more about Pivot Tables.
Additional Resources on Pivot Tables & Reports
There are quite a few websites with lots of information on Pivot Tables. I recommend these pages for more learning.
- Debra’s Pivot Table Tips & Tutorials collection [highly recommended]
- Excel Pivot Table Fundamentals & More from OzGrid
- Pivot Table blog from Debra
- Articles with Pivot Table tag on Chandoo.org


9 Responses