
Excel, Power BI, Analytics, Charts, Dashboards, Power Pivot & Power Query Videos
Welcome to our videos page. Once every two weeks, I make a new video explaining a concept of Excel or Power BI or data analytics. These videos are usually published on our free YouTube Channel as well as on the blog (and occasionally on our Facebook page). I have included some of the most popular videos on this page. For full video listing, visit our videos tag page or Youtube Channel.
What is Excel and How to use it?
Introduction to Excel. Getting started with MS Excel, spreadsheets, ribbon, shortcuts and creating a simple spreadsheet.

Calculating total working hours using Excel – example & discussion
Total working hours between two time stamps using Excel formulas.
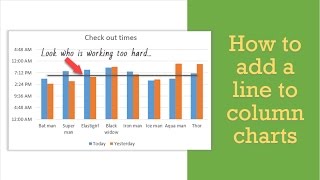
How to add a line to your column chart
Create a column and line combination chart to show target or average marker

Introduction to Power Pivot for Excel
What is Power Pivot, how to use it?
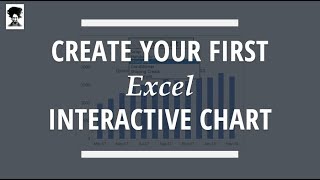
Create your first interactive chart in Excel in under 5 minutes
Make an interactive chart in Excel to show one series of data at a time using data validation or slicers.

Matching transactions (reconciling) using Excel Pivot Tables | ExcelTutorials
Reconcile debits and credits using pivot tables
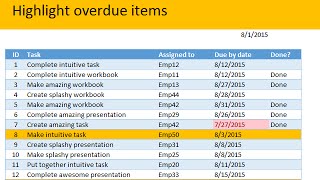
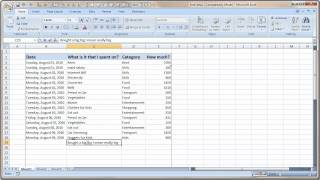
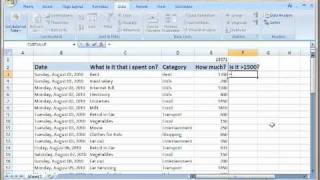
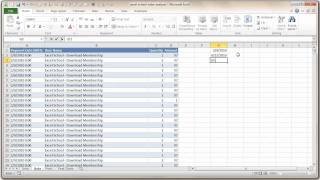
Highlight overdue items using Conditional Formatting
Which items are due, which are over due and which are not due – calculating and highlighting based on dates.

How to combine text values using CONCATENATE & TRANSPOSE functions – Excel Trick
Combine a bunch of text values to one cell – Excel trick.

Break Data in to Multiple Excel Files – How to Video
Break / split data in to multiple files from master file using Excel VBA Macros – automation.
Entering and Formatting Data in Excel
How to enter and format data in Excel – Beginner tutorial.

How to Project Dashboard Excel Template
Create a project management dashboard using Excel
Introduction to Excel Formulas & How to use them?
What are Excel formulas and functions, how to use them?

Introduction to Forecasting in Excel 2016
How to analyze and forecast time series data in Excel.

How to create an interactive chart in Excel – Tutorial
Another interactive chart in Excel

Introduction to Programming for Non-programmers
What is programming, what is VBA, how to write macros using Excel VBA – introduction video
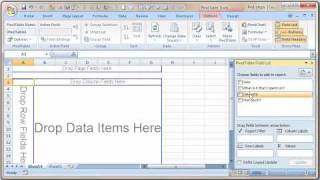
07 what is a pivot table and how to use it
What is a pivot table and how to use it? How to set up pivot tables, tips and tricks.
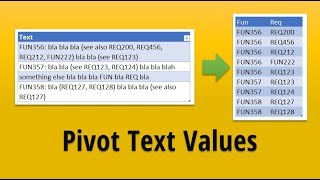
How to Pivot text values in Excel [Simple Trick]
Pivot text values using a simple trick

10 Things you can do Easily in Excel under 10 Minutes
10 Excel tips for busy people

Top 5 must know shortcuts for Better Excel Charts
Excel charting shortcuts and tricks for making awesome charts
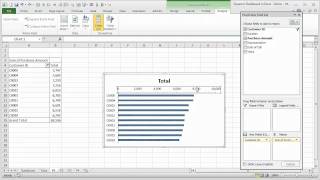
How to Analyze Sales Data with Excel
Analyze and visualize sales data, historical data using Excel
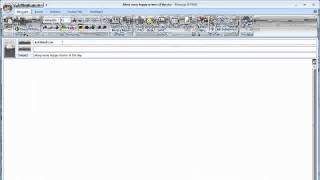
Birthday Reminder in Excel
Create and send Happy Birthday emails from Excel or any other reminder emails
Dynamic Dashboard using Excel – a Tutorial
Make a fully dynamic dashboard using Excel

Introduction to Conditional Formatting in Excel
What is conditional formatting, how to create simple rules to format your data, how to use it in Excel – introduction video
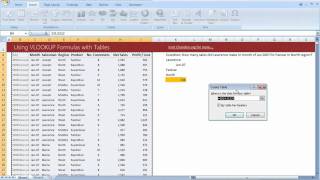
Using VLOOKUP with Excel Tables
Excel VLOOUP – how to use it with tables
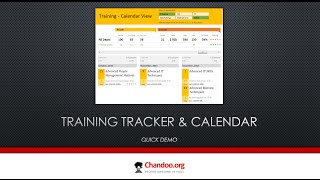
Training tracker and calendar in Excel – Quick Demo
Training Tracker and dashboard report from Excel
Want more videos?
I run a very popular online video class called Excel School. Consider joining it if you like my style and want to become awesome in Excel. Please click here for more information about Excel School online classes.


