All articles with 'downloads' Tag
CP010: Averages are Mean – 8 Techniques for making your analysis above average
Podcast: Play in new window | Download
Subscribe: Apple Podcasts | Spotify | RSS
This is a continuation of Session 9 – Averages are mean
In the earlier episode, we talked about AVERAGE and why it should be avoided. In this session, learn about 8 power analysis techniques that will lift your work above averages.
In this podcast, you will learn,
- Re-cap – Why avoid averages
- 8 Techniques for better analysis
- #1: Start with AVERAGE
- #2: Moving Averages
- #3: Weighted Averages
- #4: Visualize the data
- …
- Conclusions
CP009: Averages are Mean – Know these things before you make any more AVERAGE()s
Podcast: Play in new window | Download
Subscribe: Apple Podcasts | Spotify | RSS
In the 9th session of Chandoo.org podcast, lets raise above AVERAGEs.
AVERAGEs are a very popular and universal way to summarize data. But do you know they are mean? Mean as in, AVERAGEs do not reveal much about your data or business. In episode 9 of Chandoo.org podcast, we tackle this problem and present solutions.
In this podcast, you will learn,
- What is AVERAGE?
- Pitfalls of averages
- 5 statistic concepts you must understand
- Standard Deviation
- Median
- Quartiles
- Outliers
- Distribution of data
- What next?
Implementing Modular Spreadsheet Development – a walkthrough

This article is written by Michael Hutchens from Best Practice Modelling.
In the first article on Modular Spreadsheet Development, we got a high level overview of Modular Spreadsheet Development principles. This article discusses the practical implementation of these principles in Excel.
From my experience using Modular Spreadsheet Development over the past decade, there are three increasingly-efficient methods of implementation in Microsoft Excel:
1. Manual implementation;
2. VBA automated implementation; and
3. Commercial add-in implementation.
This article provides a comprehensive overview of each of these methods and a summary of their advantages and disadvantages.
Continue »CP008: 6 Tips to handle workbooks made by someone else, #4 is something I struggle with too!

Podcast: Play in new window | Download
Subscribe: Apple Podcasts | Spotify | RSS
Here is a problem we all face once in a while. We inherit this bulky, bloated, leaking at the edges workbook from a colleague. Now the onus of maintaining it is on us. The person who made this workbook is nowhere to be found. May be she is vacationing in Hawaii sipping pineapple juice. May be he became a vice president and roaming the country in your company’s private jet.
So what do we do? How do we handle this inheritance?
That is the topic of our podcast, episode 8.
In this podcast, you will learn,
- An overview of the inheritance problem
- 6 Tips to understand workbooks made by someone else
- Tip 0: Talk to the creator
- Tip 1: Model the workbook on paper
- Tip 2: Locate the engine, ie the formulas
- Tip 3: See what else is under the hood – hidden sheets, names, VBA code
- Tip 4: Annotate (add comments) as you learn
- Tip 5: Locate the controls – inputs, assumptions, scenarios
- Tip 6: Re-construct from scratch
- Deep dive in to understanding the formulas
- Deep dive in to understanding VBA code
- Conclusions
Building a simple timer using Excel VBA to track my Rubik’s cube solving speed [case study]
![Building a simple timer using Excel VBA to track my Rubik’s cube solving speed [case study]](https://img.chandoo.org/vba/excel-timer-demo.gif)
Today, lets learn how to make a simple timer app using Excel. First some background…,
Recently, I learned how to solve Rubik’s cube from my nephew. As a budding cuber, I wanted to track my progress. Initially I used the stopwatch in my iPhone. But it wont let me track previous times. So I thought, “Well, I can use Excel for this”.
So I made a small timer app using Excel. Its quite minimalistic. It has a single button. I press it and it tracks the start time (date & time stamp). If I press the button again, it records the duration.
This way, I can see my progress over next few weeks and may be plot the trend.
Continue »Modular Spreadsheet Development – A Thought Revolution

This article is written by Michael Hutchens from Best Practice Modelling.
This article provides a high level overview of Modular Spreadsheet Development principles. In next part the implementation of these concepts will be discussed.
Modular Spreadsheet Development – An awesome concept
I want to share a concept with you so awesome that once you understand it you may never use Excel the same way again.
This concept, called Modular Spreadsheet Development, makes it possible to build spreadsheets exponentially faster while reducing the risk of errors and making spreadsheets much easier to understand.
This concept is not completely new, but I’m writing this article because the spreadsheet modelling world would be a much better place if it was more commonly adopted.
Continue »Create a line chart with bands [tutorial]
![Create a line chart with bands [tutorial]](https://img.chandoo.org/c/line-chart-with-bands-to-depict-kpi-or-goals.png)
Here is an interesting scenario.
Imagine you are responsible for customer satisfaction at ACME Inc. Every month you track customer satisfaction rate for the 3 products you sell which are conveniently named Product A, B & C.
You also have bands for the satisfaction rating.
- Rating of 85% or below is Average
- Rating between 85% & 95% is OK
- Rating above 95% is good
At the end of the year, you want to visualize the ratings for last 12 months for 3 products along with bands.
Something like above.
Unfortunately, there is no “Insert Banded line chart” button in Excel. So what to do?
That is what we will learn today. Ready?
Continue »CP007: aweSUM() – Overview of SUM functions in Excel

Podcast: Play in new window | Download
Subscribe: Apple Podcasts | Spotify | RSS
In the 7th session of Chandoo.org podcast, lets make you aweSUM().
Imagine for a second that Excel cannot add up numbers. And no it cant subtract them either. What would that look like?
A glorified Notepad. That’s right. Excel’s ability to add up numbers, along with features like formulas, charts, pivot tables & BHATTEXT() are what make it such a lovely software. May be not the BHATTEXT(), but we all agree that Excel is so versatile and useful because it can add up numbers (and perform other calculations) with ease.
But how well do you know the SUM formulas of Excel?
In this podcast, you will learn,
- Special personal fruit announcement 😛
- + operator
- Status bar & total rows in tables
- Auto Sum feature
- SUM() function
- SUMIFS function
- Special cases of SUMIFS function
- SUBTOTAL & AGGREGATE functions
- Other summing functions – SUMPRODUCT etc.
CP006: How to be a better analyst? – Road map for getting better at Data Analysis & Improving your career prospects

Podcast: Play in new window | Download
Subscribe: Apple Podcasts | Spotify | RSS
In the 6th session of Chandoo.org podcast, we focus on making you a better analyst and propose a road map for getting better at data analysis & improving your career prospects.
In this podcast you will learn,
- Why become a better analyst?
- The road map for becoming a better analyst – BETTER framework
- B for Business Knowledge
- E for Examining user needs
- T for Thinking about analysis
- T for Tools of Trade ie Excel
- E for Expression
- R for Refining yourself
- Conclusions
Modeling tiles in a room using Excel Conditional Formatting
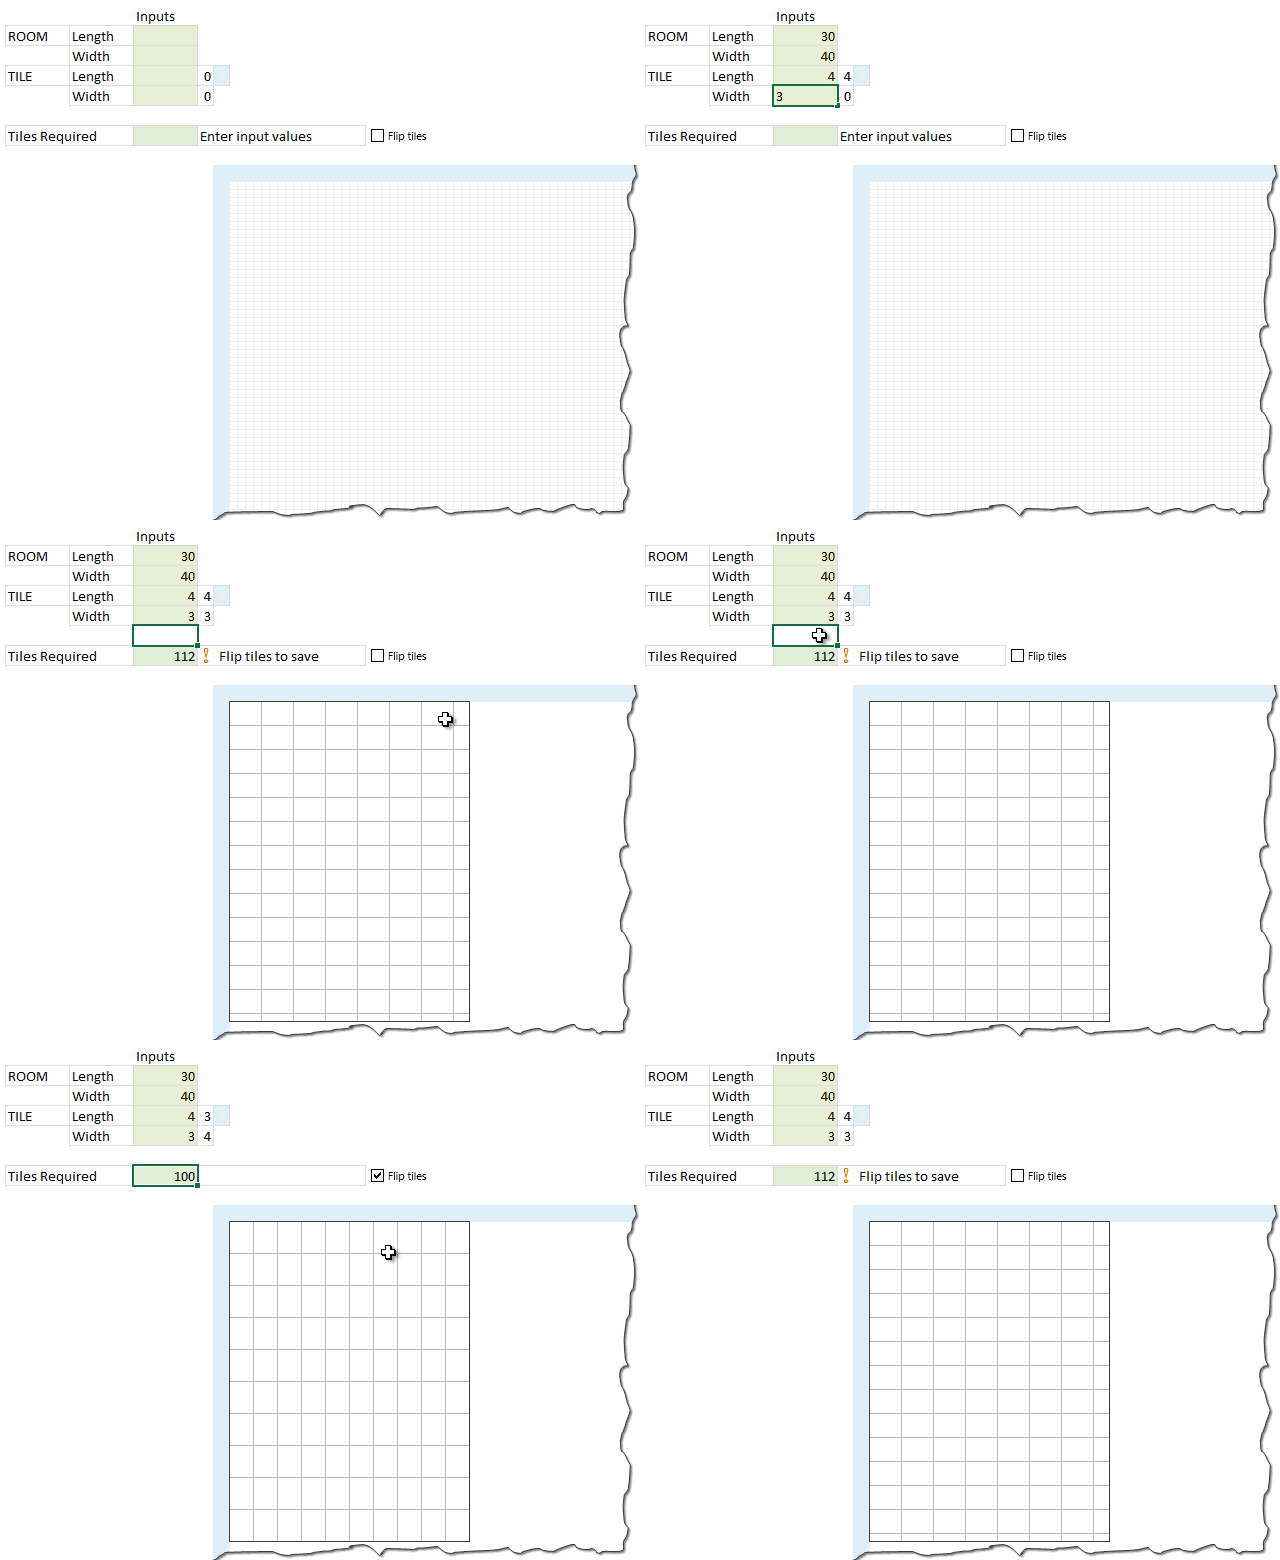
Last week we learned how to answer questions like, “How many tiles in a room?” using Excel. We learned about CONVERT function and fraction number format settings in Excel.
But why stop at calculation? We can even model a room full of tiles, thanks to Excel’s grid nature.
So today, we will learn how to create a room layout as shown above, using Excel.
Continue »There are Easter Eggs in this Excel file!!!

Hello Friends…,
It is Easter time again. Every year, we at Chandoo.org celebrate Easter by hunting for eggs (not in the wild, just in the Excel workbooks). This year too I have hidden 30 Excel tips in a workbook. You have to solve 3 puzzles to find them. So what are you waiting for. Go ahead and hunt for them eggs.
Click here to download the Easter eggs file.
I am sure you will enjoy them 🙂
Continue »CP005: Introduction to Form Controls – an interview with Debra Dalgleish
Podcast: Play in new window | Download
Subscribe: Apple Podcasts | Spotify | RSS
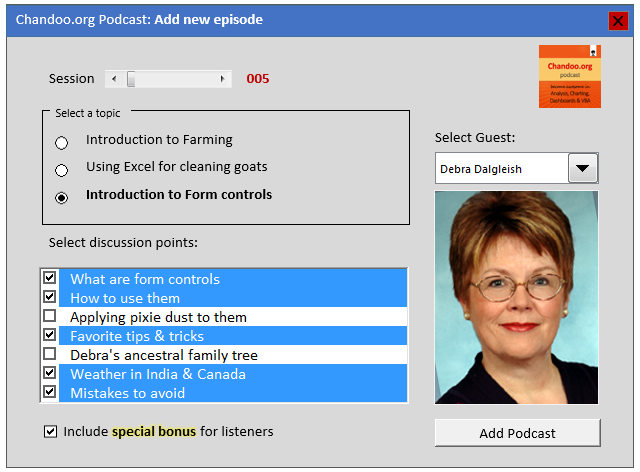
In the 5th session of Chandoo.org podcast, we are going to demystify form controls.
I am very happy and excited to interview my good friend, fellow Excel MVP, author, blogger and virtual mentor – Debra Dalgleish about this topic.
In this podcast, you will learn,
- What are form controls
- When you would use them?
- Example form control – Combo box
- How form controls differ from active-x controls
- How to enable form controls in your Excel?
- Various important form controls
- Special bonus & how to obtain it
Multiplying 24ft 9inches with 6ft 3inches using Excel
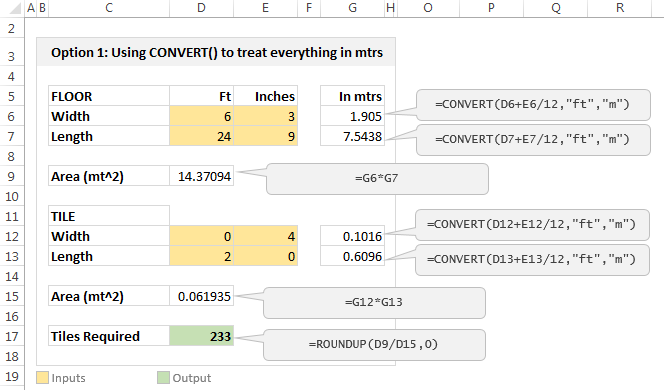
Imagine you are a carpenter and you are tasked with laying wooden floor at Gill Bates’ house. Now Gill B has a very big house and he wants to make sure you do a good job. So instead of asking you to lay the floor for entire house, he asks you to finish flooring in the guest bedroom first. Here are the dimensions of that guest bedroom.
- Width: 6ft 3inches
- Length: 24ft 9inches
- Size of individual wooden floor board: 2ft x 4inches
And here is the big question you are facing.
What?!? the guest bedroom width is only 6ft 3inches?
But over the years of chiseling and polishing you have learned to keep quiet and do your work.
So the real question you have is, How many wooden floor boards should you buy?
Of course, you want to find the answer using Excel. Why else would a carpenter read this blog?
Continue »Visualize state to state migration data and you could win an iPad or Galaxy Tab [Datavis Contest 2014]
![Visualize state to state migration data and you could win an iPad or Galaxy Tab [Datavis Contest 2014]](https://chandoo.org/wp/wp-content/uploads/2014/04/chandoo-datavis-contest-2014-prizes.jpg)
Time for another dashboard contest. Sit straight, set aside your appointments and get number-crunching.
Analyze state to state migration data between 2012 & 2010 and present your results in a dashboard (or charts) and you could walk away with glory, fame & and an iPad.
If all of this sounds tempting, read on.
The contest
- Download dataset for the contest [mirror]
- Analyze the data and create a dashboard or set of charts (see rules below)
- Submit your workbook by 20th of April (Sunday), 2014.
- If readers at chandoo.org and our panel of judges love your work, you get one of the cool prizes.
Calculating Maximum Change [solutions & discussion]
![Calculating Maximum Change [solutions & discussion]](https://img.chandoo.org/hw/maximum-change-problem-solutions-and-video.jpg)
Last Friday, we had a fun little Excel challenge – Calculate Maximum Change. More than 170 people commented and shared their solutions to this problem.
And the best part?
The best part is the variety of solutions & thinking displayed by our community. So if you are one of those 170, puff your chest & pat yourself on the back. Go ahead, I will wait.
Today, lets take a look at some of these awesome formulas and understand how they work. Read on and watch the video you below to gain few awesomeness pounds.
Continue »

