All articles with 'Microsoft Excel Conditional Formatting' Tag
Find and Highlight all blank cells in your data [Excel tips]
![Find and Highlight all blank cells in your data [Excel tips]](https://chandoo.org/wp/wp-content/uploads/2015/04/find-highlight-blank-cells-in-excel.png)
True story:
On Friday (17th April – 2015), I flew from Vizag (my town) to Hyderabad so that I can catch a flight to San Francisco to attend a conference. As I had 10 hours of overlay between the flights in Hyderabad, I checked in to a lounge area so that I can watch some sports, eat food while pretending to do work on my laptop. There was a gentleman sitting in adjacent space doing some work in Excel. As I began to compose few emails, the gentleman in next sitting space asked me what I do for living. Our conversation went like this.
Me: I run a software company
He: Oh, so you must be good with computers
Me: smiles and cringes at the stereotyping
He: What is the formula to select all the blank cells in my Excel data and highlight them in Yellow color
Mind you, he had no idea that I work in Excel. We were 2 random guys in airport lounge watching sports and eating miserable food.
Me: Well, what are you trying to do?
He: You see, I am auditing this data. I need to locate all the blank rows and set them in different color so that my staff can fill up missing information. Right now, I am selecting one row at a time and filling the colors. Is there a one step solution to this problem?
Needless to say, I showed him how to do it faster, which led to an interesting 3 hours at the lounge.
End of true story.
So today, let’s understand how to find & highlight all the blank cells in the data.
Continue »
Learn two techniques to conditionally format the background of a chart based on some external value.
Continue »How to check for hard-coded values in Excel formulas?
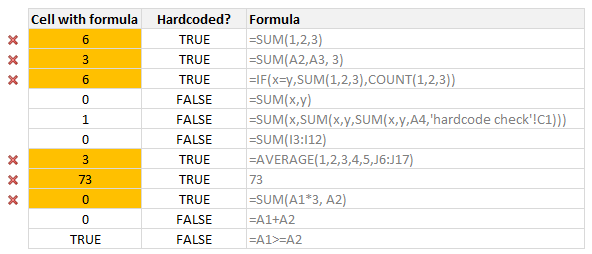
Here is a common problem. Imagine you are looking a complex spreadsheet, aptly titled “Corporate Strategy 2020.xlsx” which as 17 tabs, umpteen formulas and unclean structure. Whoever designed it was in insane hurry. The workbook has formulas like this, =SUM(Budget!A2:A30, 3600)+7925 .
It was as if Homer Simpson created it while Peter Griffin oversaw the project.
So how do you go about detecting all cells containing formulas with hard-coded values?
Continue »Compare 2 sets of data by letter or word & highlight mismatches [vba]
![Compare 2 sets of data by letter or word & highlight mismatches [vba]](https://img.chandoo.org/vba/compare-2-texts-by-letter-word-demo.gif)
We analysts like to compare. If you ever want to keep an analyst busy, just give her 2-3 options. She won’t return to your desk until the cows come home. My wife uses this trick all the time. Picture this:
[In late 2013]
Me: I want to buy a new phone
She: Do you want Nexus 5 or Galaxy S5 or iPhone 5s?
Its late 2014 and I am not done comparing.
So today, let’s talk about an interesting comparison scenario.
Comparing by letter or word
See above demo to understand the concept. Read more to learn how to do this.
Continue »Excel to the Next Level by Mastering Multiple Occurrences

This is a guest post by Sohail Anwar.
August 29, 1994. A day that changed my life forever. Football World Cup? Russia and China de-targeting nuclear weapons against each other? Anniversary of the Woodstock festival?
No, much bigger: Two Undertakers show up at WWE Summerslam for an epic battle. Needless to say: MIND() = BLOWN().
And thus begun one boy’s journey into understanding the phenomenon of Multiple Occurrences.
My journey continued, when just a few years later my grandfather handed me down a precious family heirloom: A few columns of meaningless data that I could take away and analyze in Excel. You may laugh but in the 90’s, every boy only wanted two things 1) Lists of pointless data and …
Continue »A better chart to visualize “Best places to live” – Top 100 cities comparison Excel chart
Recently, I saw this chart on Economist website.
It is trying to depict how various cities rank on livability index and how they compare to previous ranking (2014 vs 2009).
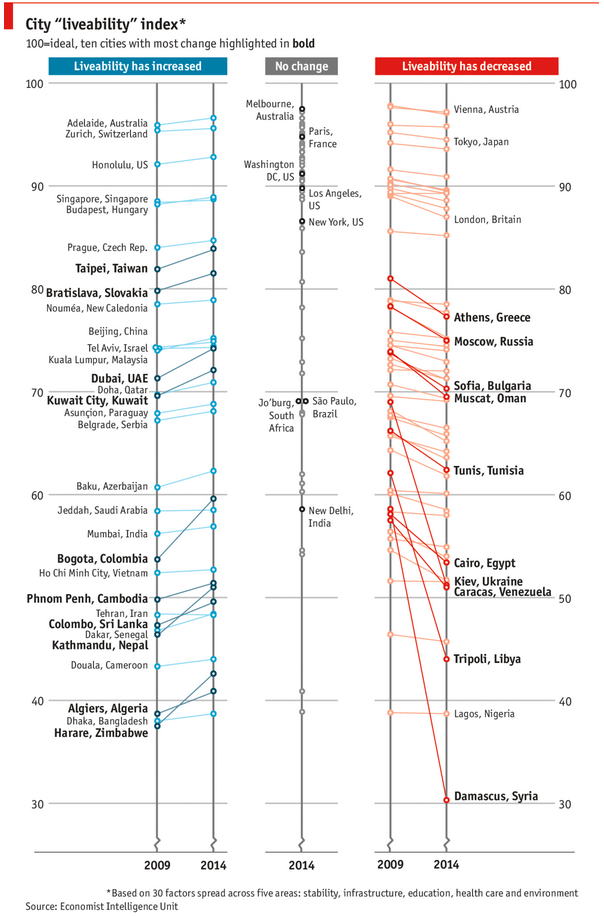
As you can see, this chart is not the best way to visualize “Best places to live”.
Few reasons why,
- The segregated views (blue, gray & red) make it hard to look for a specific city or region
- The zig-zag lines look good, but incredibly hard to understand % changes (or absolute changes)
- Labels are all over the place, thus making data interpretation hard.
- Some points have no labels (or ambiguous labels) leading to further confusion.
After examining the chart long & hard, I got thinking.
Its no fun criticizing someones work. Creating a better chart from this data, now thats awesome.
Continue »CP021: How to quickly compare 2 lists in Excel
Podcast: Play in new window | Download
Subscribe: Apple Podcasts | Spotify | RSS
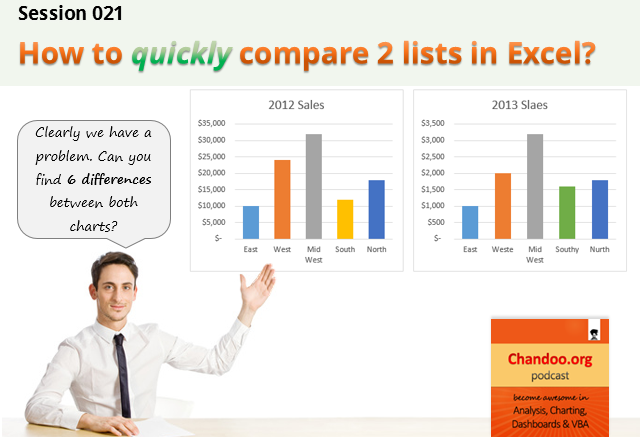
In the 21st session of Chandoo.org podcast, lets compare lists. Quickly
What is in this session?
Comparing things is a favorite pastime for analysts all over the world. Sadly, it is also an area where we waste hours. So in this episode, I share my top secret comparison techniques to save you time.
Note: This is a short format podcast. That means you spend less time listening to it, while becoming more awesome.
In this podcast, you will learn,
- Why I sound like I am on a secret mission at a mafia hideout.
- 5 ways to compare 2 lists
- Manual method
- Conditional Formatting
- Row Differences
- LOOKUP formulas
- COUNTIF formulas
- Bonus tip: Removing duplicates
- Conclusions
CP011: 5 Excel magic tricks to impress your boss

Podcast: Play in new window | Download
Subscribe: Apple Podcasts | Spotify | RSS
If you want to create magical effect with your Excel workbook (or report, dashboard, model), then hear no further. In this episode, we explore 5 very powerful magic tricks you can apply to get jaw dropping reactions from your bosses, clients & colleagues.
In this podcast, you will learn,
- Annoucements
- Why magic
- 5 Excel Magic Tricks
- 1: Conditional formatting
- 2: Form controls + Charts
- 3: Pivot tables + Slicers
- 4: Macros + Automation
- 5: Using right feature @ right time
- How to learn these magic tricks
- Conclusions
Top 10 things we struggle to do in Excel & awesome remedies for them

Recently we asked you, what do you struggle doing in Excel? 170 people responded to this survey and shared their struggles. In this post, lets examine the top 10 struggles according to you and awesome remedies for them.
Continue »Hello everyone. Stop reading further and go fetch your helmet. Because what lies ahead is mind-blowingly awesome.
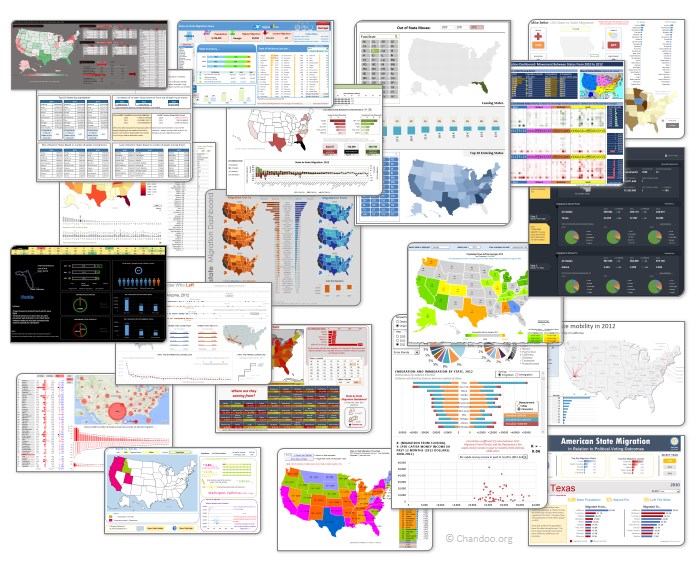
About a month and half ago, we held our annual dashboard contest. This time the theme is to visualize state to state migration in USA. You can find the contest data-set & details here.
We received 49 outstanding entries for this. Most of the entries are truly inspiring. They are loaded with powerful analysis, stunning visualizations, amazing display of Excel skill and design finesse. It took me almost 2 weeks to process the results and present them here.
Click on the image to see the entries.
Continue »Modeling tiles in a room using Excel Conditional Formatting
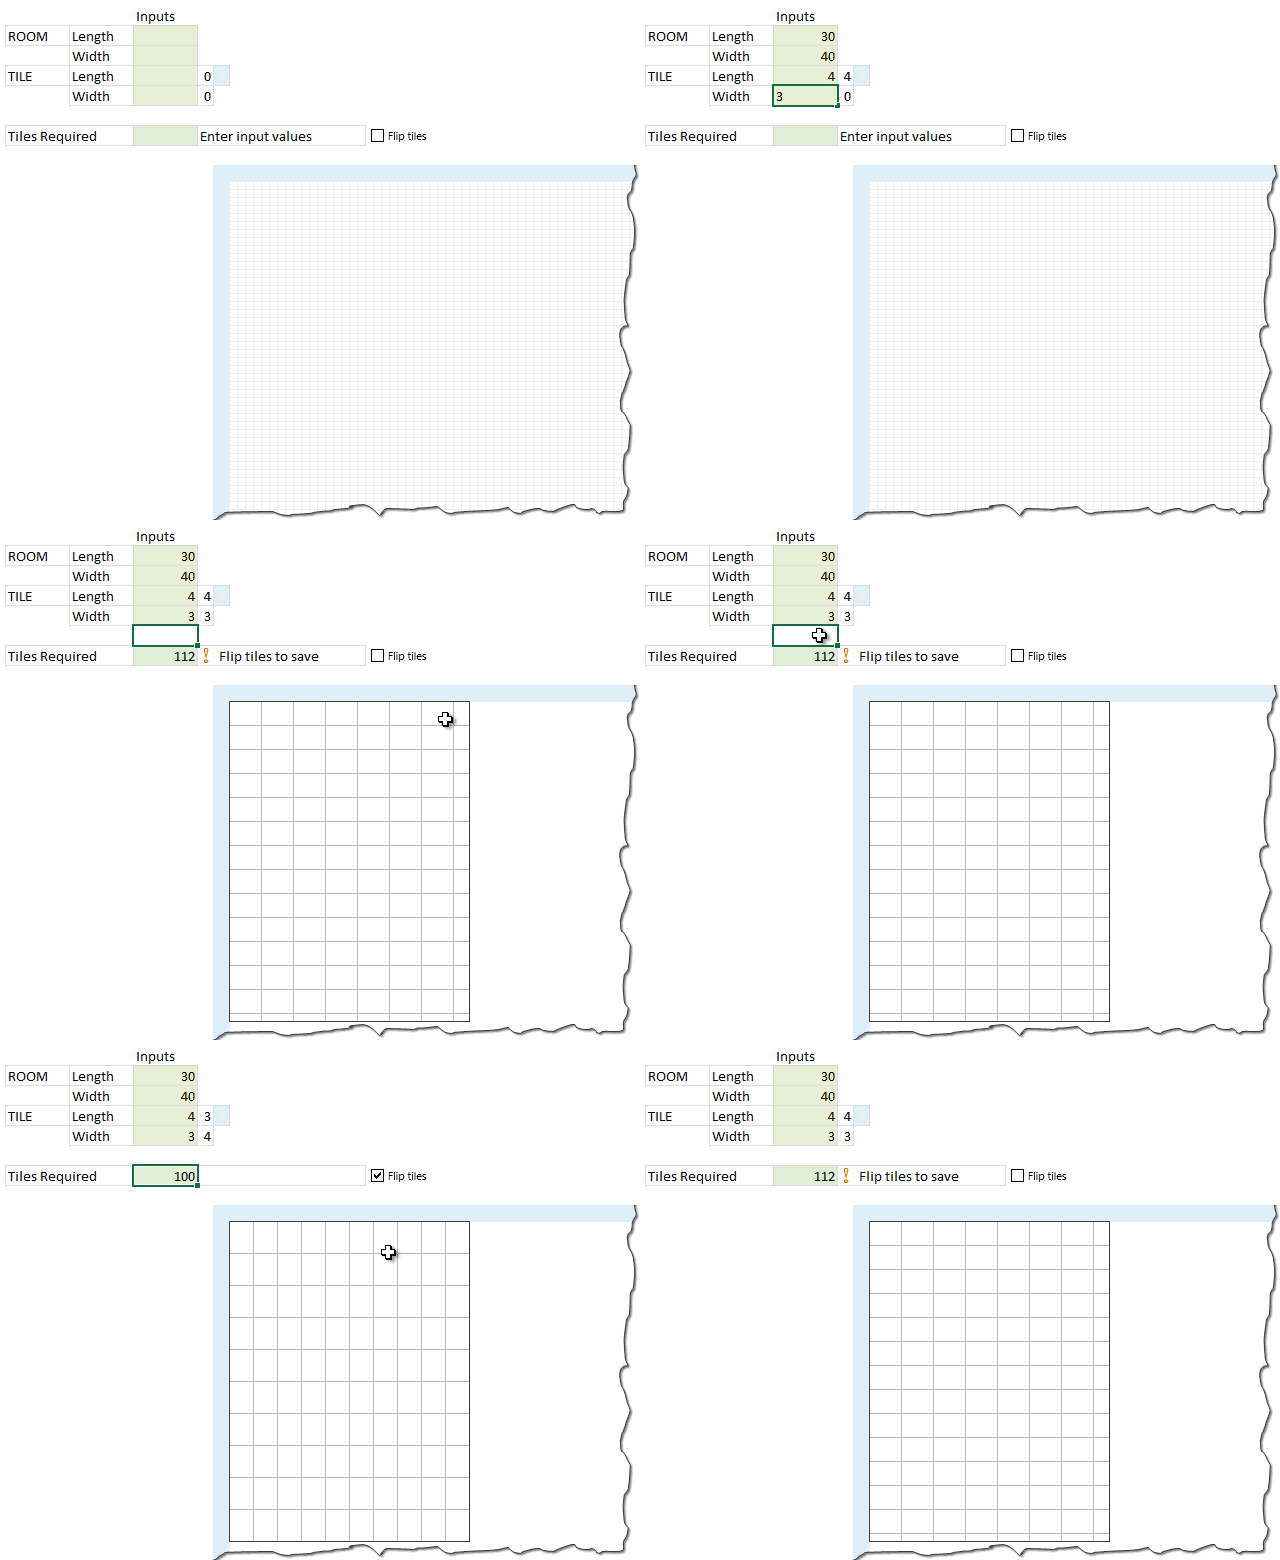
Last week we learned how to answer questions like, “How many tiles in a room?” using Excel. We learned about CONVERT function and fraction number format settings in Excel.
But why stop at calculation? We can even model a room full of tiles, thanks to Excel’s grid nature.
So today, we will learn how to create a room layout as shown above, using Excel.
Continue »Free Invoice Template using Excel – Download
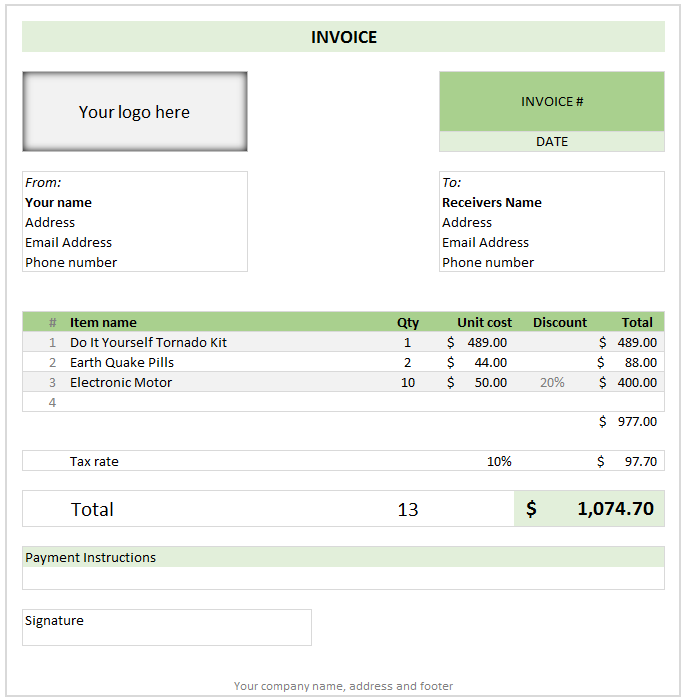
Anyone running a small business knows the oozing bits of joy when you hear a customer saying, “Can you send me an invoice?”
While creating an invoice is an easy task, if you want something that is professional looking, easy to manage and works well, then you are stuck.
That is where Excel really shines. By using an invoice template, you can quickly create and send invoices.
Today I want to share one such template with you all. Why? Because we are awesome like that.
Continue »Quick and easy Gantt chart using Excel [templates]
![Quick and easy Gantt chart using Excel [templates]](https://img.chandoo.org/pm/quick-gantt-chart-template-excel.png)
Gantt charts are a very popular way to visually depict project plans. Today, let us learn how to use Excel to make quick & easy Project Plan Gantt Chart.
This is what we will be creating.
Continue »Top 10 things I learned using Excel for a decade

Sometime during the 2nd half of 2013, I finished 10 years of Excel usage. In the last 10 years, I completed my studies, got my first job, married, had kids, visited 15 different countries, quit my job to start a business, bought first car, first house, made dozens of new friends, read 100s of books, wrote a book and learned 1000s of new things. And all along, Excel stayed a true companion. Right from MBA entrance exam preparation in 2003 to making my summer internship project reports in 2005 to planning my wedding expenses in 2007 to getting a promotion in 2009 to planning my kids feeding schedule in 2010 to running a successful business in 2014, Excel helped me in every step.
So today, I want to tell you the top 10 things I learned using Excel in last decade. Grab a hot cup of coffee, buckle your belts and get ready for time travel.
Continue »Free 2014 Calendar, daily planner templates [download]
![Free 2014 Calendar, daily planner templates [download]](https://chandoo.org/wp/wp-content/uploads/2014/01/free-calendar-and-daily-planner-template-2014.png)
Here is a New year gift to all our readers – free 2014 Excel Calendar & daily planner Template.
This calender has,
- One page full calendar with notes, in 4 different color schemes
- Daily event planner & tracker
- 1 Mini calendar
- Monthly calendar (prints to 12 pages)
- Works for any year, just change year in Full tab.

