All articles with 'guest posts' Tag
Dressing Financial Statements – What Motivated Mr. Bean to Defraud Latte?
Did you know What Happened at Last Coffee Day?
Mr. Bean “dressed up” the financial statements and was caught in the fraud. But he was the CEO of Latte! So why did he commit fraud in his own company??
Any Guess?
Take a cappuccino and I will give you a hint – How was Mr. Bean’s Bonus to be decided?
Read on to know more…
Continue »Macros for Automatically Implementing Modeling Best Practices

In the first part on our Modeling Best Practices series, we learned 5 best practices to follow. This article shows how to automatically implement the best practices using macros.
Continue »Financial Ratios – Cappuccino or Latte?

A Quick Question for you!
Don the hat of a financial wiz today. What I have for you are the financials of two companies: Cappuccino and Latte – Two dot com companies (Sometimes they also make revenues ;-))
Which is better – Cappuccino or Latte? ( Hint: It’s a trick question! 😉 )
It may seem obvious that Latte is performing better (Higher the revenue, the better the performance!). Sometimes a single source of data does not speak the full story!
Continue »Journey of Hurricane Sandy – Animated Excel Chart

Hurricane Sandy has taken front seat in all major news channels, papers, websites even in far off places like India. I hope & pray that our readers in US East coast are safe.
Today, lets understand the journey of Hurricane Sandy in this animated chart, prepared by Chris from Excel365.
Continue »Best Practice Modeling – Make these 5 changes today

Our guest author, Myles Arnott discusses what Best Practice Modeling is and offers 5 practical, easy to implement tips to get you started.
Best Practice Tip #1: Apply a modeling life cycle
Best Practice Tip #2: Give structure to your spreadsheets
Best Practice Tip #3: Make cells consistent based on their behavior
Best Practice Tip #4: Use similar formulas
Best Practice Tip #5: Build error checks in to your models
Read on…
Continue »75 Excel Speeding up Tips Shared by YOU! [Speedy Spreadsheet Week]
![75 Excel Speeding up Tips Shared by YOU! [Speedy Spreadsheet Week]](https://img.chandoo.org/optimize/excel-speeding-up-tips-by-you.jpg)
As part of our Speedy Spreadsheet Week, I have asked you to share your favorite tips & techniques for speeding up Excel. And what-a-mind-blowing response you gave. 75 of you responded with lots of valuable tips & ideas to speed-up Excel formulas, VBA & Everything else.
Thanks to all the contributors
Many thanks to everyone who shared their tips & ideas with us. If you like the tips, please say thanks to the contributor.
Read Excel Speeding-up tips by area
This page is broken in to 3 parts, click on any link to access those tips.
Read everything
Formula Speeding-up Tips
VBA / Macros Optimization Tips
Everything Else
Share your tips
Excel Speedup & Optimization Tips by Experts [Speedy Spreadsheet Week]
![Excel Speedup & Optimization Tips by Experts [Speedy Spreadsheet Week]](https://img.chandoo.org/optimize/excel-expert-tips-for-optimization-speedup.jpg)
As part of Speedy Spreadsheet Week, I have emailed few renowned Excel experts and asked them to share their tips & ideas to speedup Excel. Today, I am glad to present a collection of the tips shared by them. Read the Excel optimization & speeding up tips shared by Hui, Luke, Narayan, George, Gregory & Jordon.
Continue »Yet Another Sales Funnel Chart in Excel

A while ago, our reader Shay emailed me a Sales Funnel chart template.
I had to create a sales funnel for my company and I looked all over the internet to see how to do what I needed to do. I couldn’t find anything. I tried your funnel chart as well but because my numbers are all over the place I couldn’t get it to work for me.
I get so much information from you that I decided to share this chart with you. I used the shapes drawings to create the funnel graphic and the camera tool to place the values in each shape. I used formulas in the original data so that I will not have to recalculate every month.
I took the liberty of making little changes to Shay‘s funnel chart template to make it even better. Here is how the funnel looks like.
Continue »
Project Managers often report financial numbers to the management. In a dynamic world, these numbers are usually based on a lot of factors that may or may not be under your control. So the top management demands that the numbers be reported as per different economic scenarios – Optimistic, Normal or Pessimistic. It is important […]
Continue »Using external software packages to manage your spreadsheet risk [Part 4 of 4]
![Using external software packages to manage your spreadsheet risk [Part 4 of 4]](https://img.chandoo.org/g/spreadsheet-risk-management.png)
Background – Spreadsheet Risk Management
In the Managing Spreadsheet Risk series so far we have looked at the concept of spreadsheet risk and how to manage it both at a company level and at a spreadsheet level using Excel functionality. In this final article we are going to have a quick look at an example of spreadsheet auditing software.
What to look for in a Spreadsheet Risk Management Software
First off I should state that there is a wide range of spreadsheet auditing solutions in the marketplace of different types and styles and at a variety of costs. In this section I would like to take a little time to explain the criteria we applied when we were sourcing auditing software.
Continue »Excel’s Auditing Functions [Spreadsheet Risk Management – Part 3 of 4]
![Excel’s Auditing Functions [Spreadsheet Risk Management – Part 3 of 4]](https://chandoo.org/img/g/spreadsheet-risk-management.png)
This series of articles will give you an overview of how to manage spreadsheet risk. These articles are written by Myles Arnott from Excel Audit Part 1: An Introduction to managing spreadsheet risk Part 2: How companies can manage their spreadsheet risk Part 3: Excel’s auditing functions Part 4: Using external software packages to manage […]
Continue »How Companies Can Manage Spreadsheet Risk [Part 2 of 4]
![How Companies Can Manage Spreadsheet Risk [Part 2 of 4]](https://chandoo.org/img/g/spreadsheet-risk-management.png)
In the second installment on Excel Spreadsheet Risk Management, Myles takes a look at How companies can manage spreadsheet risk?.
He tells us, how we can set a formal governance framework to reduce or mitigate spreadsheet risk. Go ahead and read. And please tell us how your company manages spreadsheet risk in comments.
Continue »Introduction to Spreadsheet Risk Management

This series of articles will give you an overview of how to manage spreadsheet risk. These articles are written by Myles Arnott from Excel Audit
Part 1: An Introduction to managing spreadsheet risk
Part 2: How companies can manage their spreadsheet risk
Part 3: Excel’s auditing functions
Part 4: Using external software packages to manage your spreadsheet risk
The potential impact of spreadsheet error hit the UK business news recently after a mistake in a spreadsheet resulted in outsourcing specialist Mouchel issuing a major profits warning and sparked the resignation of its chief executive. Over the next few weeks we will look at the risk spreadsheets can introduce to an organisation and the steps that can be taken to minimise this risk.
Continue »Quickly Fill Blank Cells in a Table [Reader Tip]
![Quickly Fill Blank Cells in a Table [Reader Tip]](https://img.chandoo.org/q/fill-blank-cells-1.png)
This post is authored by Martin, one of our readers.
Situation:
Sometimes I encounter data in my tables with blank cells where there is a repeated value from the cell directly above. See below:
This can be annoying when it comes to interpreting the data and when sorting columns.
Solution:
To know how I solve this, just read rest of the article.
Continue »MLB Pitching Stats Dashboard in Excel+VBA by our VBA Class Student

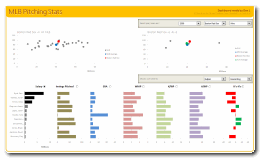
Nothing gives a teacher more satisfaction than seeing a student apply the knowledge to do something awesome. So naturally, I jumped with joy when I got this email from Dan, one of my VBA Class students,
Hi Chandoo,
After going thru your VBA Classes, I realized that we can lots of awesome stuff with pivot tables + simple macros. I recently created an Excel Dashboard to depict MLB (Major League Baseball) Pitching Stats. I could not have done this had I not learned VBA. Thank you so much for teaching the class.
I got curious and requested Dan, if I could share the file with you all. Being a lovely person, Dan agreed immediately.
Continue »

