All articles with 'guest posts' Tag
![Designing awesome financial metrics dashboard [tutorial]](https://img.chandoo.org/contests/mv2016/rs/09-chandeep-c.png)
In this amazing guest post, the winner of our 2016 dashboard contest – Chandeep – Explains how he constructed the jaw dropping beauty (shown above) using Excel, creativity, love and sweat. Grab a full cup of coffee (or whatever liquid fancies you) and read on. Take lots of notes and play with the ideas in Excel while reading to maximize your learning.
Thanks Chandeep.
Continue »{ 16 Comments }
How to create animated charts in Power Point [VBA]
Published on Mar 17, 2016 in Charts and Graphs, Office Tips
![How to create animated charts in Power Point [VBA]](https://chandoo.org/wp/wp-content/uploads/2016/03/animated-power-point-chart-demo.gif)
This is a guest post by Chirayu, a member of Chandoo.org forum.
Animating Charts in PowerPoint cannot be done without the help of 3rd party software’s that create a flash file of the chart & embed it into the presentation.
However there is a workaround for this. Save your chart as multiple images & insert them (overlapping on top of each other). Use VBA on Developer tab Controls such as Combo Box, Option Button, Check Box etc. to “Bring To Front”” the corresponding image. Thus giving the illusion of an Animated Chart in PowerPoint.
This guide will teach you how to animate the charts, using the three Developer tab Controls that were mentioned before. The code & functionality only works in Slide Show Mode. File must be saved as PowerPoint Macro-Enabled Presentation (*.pptm)
Continue »{ 18 Comments }
8 Reasons you must get better at Excel in 2015
Published on Jan 12, 2015 in Learn Excel

This is a guest post by Sohail Anwar.
Why do so many of us use Excel? Let’s trace it back to the ’80s when Microsoft hit gold by being the first out of the blocks with the widely available operating system that was somewhat dummy proof.
Suddenly everyone could aspire to launch ‘Nukes’ like a fresh faced Matthew Broderick in the film ‘War Games’.
By the early 90’s Windows had become even more established relative to other Operating Systems, so much so that PC manufacturers were developing components around Windows’ capabilities and suddenly PCs were Windows machines. As big business began accepting the significance of computing, Microsoft started winning huge licensing contracts with all the major corporations in all sectors, but the Finance sector in particular, where Excel would be king, was having an exponential boom at this time. For big organisations, once you spent a fortune buying licences for the Operating System it only made sense to purchase the seamlessly integrated and carefully developed/tested apps to run on them; enter Excel, Word, PowerPoint and eventually Outlook. Fast forward to 2015 and we are firmly in the age of second generation corporate professionals who have developed much of their productivity skill sets around those particular Windows tools. While all the excellent tools have their place, Excel stands out and here are 8 reasons why you need to up your Excel game more than ever this year.
Continue »{ 60 Comments }
Excel to the Next Level by Mastering Multiple Occurrences
Published on Dec 9, 2014 in Learn Excel

This is a guest post by Sohail Anwar.
August 29, 1994. A day that changed my life forever. Football World Cup? Russia and China de-targeting nuclear weapons against each other? Anniversary of the Woodstock festival?
No, much bigger: Two Undertakers show up at WWE Summerslam for an epic battle. Needless to say: MIND() = BLOWN().
And thus begun one boy’s journey into understanding the phenomenon of Multiple Occurrences.
My journey continued, when just a few years later my grandfather handed me down a precious family heirloom: A few columns of meaningless data that I could take away and analyze in Excel. You may laugh but in the 90’s, every boy only wanted two things 1) Lists of pointless data and …
Continue »{ 173 Comments }
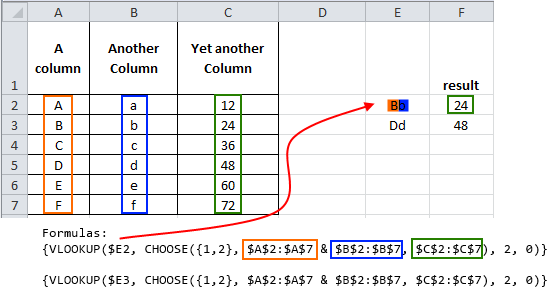
The ultimate VLOOKUP trick – Multi-condition Lookup
Published on Oct 28, 2014 in Learn Excel
This is a guest post by Sohail Anwar.
Let’s not bore you with an intro. You are about to learn a VLOOKUP trick that Lucifer himself would not want you to know. It’s so absurdly powerful that it was developed in a lab and had to be tested on Rocky’s arch nemesis Ivan Drago.
Presenting the Multiple criteria VLOOKUP!
…boring…pass, we’ve seen it.
Oh, have you? Not like this you haven’t. This will change the way you work with Excel.
Let me start with an easy example. Here’s some data and we would love to know what Bb and Dd is.
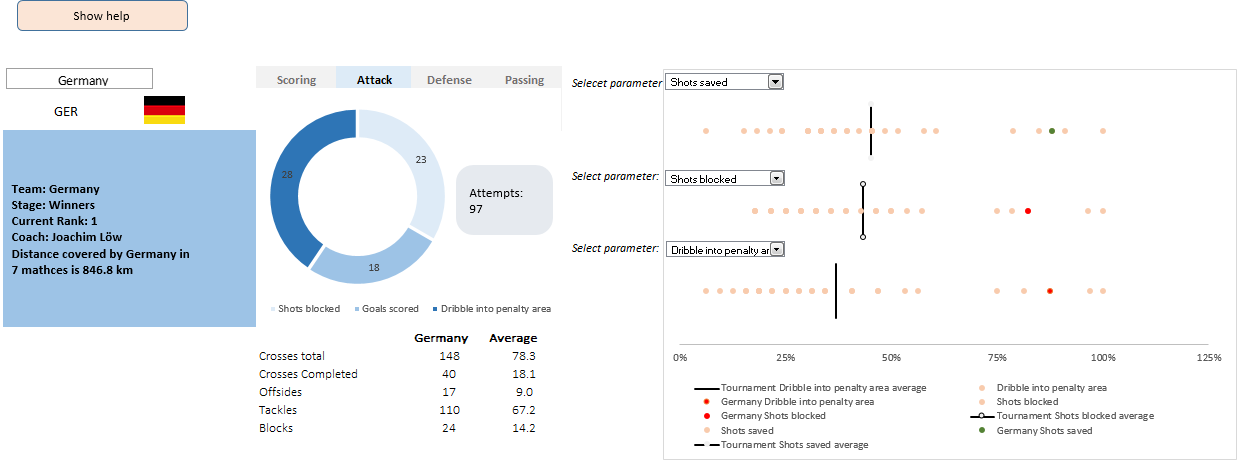
Continue »This is a guest post by Krishna, a football lover & one of our readers.
The wait for lifting the most valued priced in football for Germans was finally over. For a football fan, world cup is best time that is scheduled every four years and that if your favorite team lifting the trophy is like your crush is going on a date with you. 🙂
A sneak-peek at the final dashboard
Here is the final dashboard (it has more functionality than depicted). Click on it to enlarge.
{ 8 Comments }
Here is a simple solution to your forgetful, leaky brian – “Just put it in a spreadsheet”
Published on Jul 14, 2014 in Learn Excel

This is a guest post written by Joel Zaslofsky, author of Experience Curating.
How to Make “Put It in a Spreadsheet” Who You Are (and Not Just What You Do)
It seemed like a crazy question:
Could I use my passion for Excel as motivation to transform my leaky brain from a weakness into a strength?
Sure, I already had a fifteen year love affair going with Excel.
Every other email I sent to my co-workers had an attached Excel spreadsheet. And when I wasn’t using Excel for work purposes, I was using it for grocery list templates or budget tracking.
But I had to discover the answer to my crazy question.
So I told my wife Melinda in January 2012, “Honey, this is the year I put it in a spreadsheet!”
Continue »{ 7 Comments }
Implementing Modular Spreadsheet Development – a walkthrough
Published on May 21, 2014 in Financial Modeling, VBA Macros

This article is written by Michael Hutchens from Best Practice Modelling.
In the first article on Modular Spreadsheet Development, we got a high level overview of Modular Spreadsheet Development principles. This article discusses the practical implementation of these principles in Excel.
From my experience using Modular Spreadsheet Development over the past decade, there are three increasingly-efficient methods of implementation in Microsoft Excel:
1. Manual implementation;
2. VBA automated implementation; and
3. Commercial add-in implementation.
This article provides a comprehensive overview of each of these methods and a summary of their advantages and disadvantages.
Continue »{ 24 Comments }
Modular Spreadsheet Development – A Thought Revolution
Published on May 7, 2014 in Financial Modeling

This article is written by Michael Hutchens from Best Practice Modelling.
This article provides a high level overview of Modular Spreadsheet Development principles. In next part the implementation of these concepts will be discussed.
Modular Spreadsheet Development – An awesome concept
I want to share a concept with you so awesome that once you understand it you may never use Excel the same way again.
This concept, called Modular Spreadsheet Development, makes it possible to build spreadsheets exponentially faster while reducing the risk of errors and making spreadsheets much easier to understand.
This concept is not completely new, but I’m writing this article because the spreadsheet modelling world would be a much better place if it was more commonly adopted.
Continue »{ 59 Comments }
Robust Dynamic (Cascading) Dropdowns Without VBA
Published on Feb 25, 2014 in Learn Excel, Posts by Jeff
Recently I posted about how you could construct dynamic (cascading) dropdowns that could easily handle multiple levels, like this: …and we saw that users could subsequently change upstream dropdowns in a way that would make downstream choices invalid, like this: In my previous post I used some VBA to clear out any ‘downstream’ choices if […]
Continue »Dynamic dropdowns are a handy way to get your users to make choices based on what they’ve previously chosen, while steering them away from making invalid choices. Today we’re going to look at one that easily handles multiple levels, and we’ll take a look at what could go wrong. Let’s see one in action, shall […]
Continue »{ 11 Comments }
Combine pie and xy scatter charts – World Polls chart revisited
Published on Feb 4, 2014 in Charts and Graphs, Cool Infographics & Data Visualizations

Few days ago, we learned how to create a pie+donut combination chart to visualize polls around the world in 2014. It generated quite a bit of interesting discussion (47 comments so far). One of the comments was from Roberto, who along with Kris & Gábor runs The FrankensTeam an online library of advanced Excel tricks, charts and other mind-boggling spreadsheet wizardry.
I really liked Roberto’s comments on the original post and a charting solution he presented. So I asked him if he can do a guest post explaining the technique to our audience. He obliged and here we go.
Over to FrankensTeam.
Continue »{ 55 Comments }
Did Jeff just chart?
Published on Jan 27, 2014 in Charts and Graphs, Cool Infographics & Data Visualizations, Posts by Jeff

How do you segment customers by revenue easily in Excel, so that you can see which customer groups to focus on. Find out, and download this handy template.
In this charting example, Jeff, our guest author, occasional charter and Excel wizard shows us how to segment customers based on revenue and depict the result using Excel charts.
Continue »{ 12 Comments }
Creating Triangular Plots using Excel
Published on Dec 9, 2013 in Charts and Graphs, Posts by Faseeh
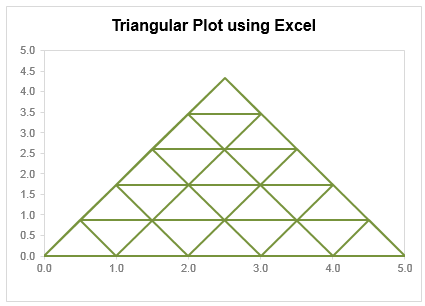
Triangular plot…! What is it?
Recently, a Chandoo.org forum member asked this,
‘I want to be able to make a graph that, in some aspects, looks like below, but I have no idea how to do it at all.’
After seeing it, I said to myself in Barney Stinson’s tone, ‘Challenge Accepted!‘
The final plot looks like above. Read on to learn how this is made.
Continue »{ 23 Comments }
Secret Agent KV’s Chops…what’s in HIS Personal Macro Workbook?
Published on Nov 19, 2013 in Posts by KV, VBA Macros
Yesterday, I talked about how you don’t have to know how to code in order to highly leverage VBA. All you need to know is how to Google, Cut, and Paste. As discussed then, I ‘volunteered’ KV under pain of exposure to empty the contents of his secret satchel onto the virtual table, so that […]
Continue »
