All articles with 'downloads' Tag
Holiday Request Form in Excel [Awesome Ways our Readers are using Excel]
![Holiday Request Form in Excel [Awesome Ways our Readers are using Excel]](https://chandoo.org/img/g/holiday-request-form-download.png)
Theodor, one of our readers, first emailed me in December asking a question. But he also made a promise to share some of his techniques with us thru Guest posts. Naturally, I was too happy and invited him to share a file or two so that I can use them for articles here.
Later during Christmas holidays, he sent me this beautiful Holiday Request Form made using Excel.
Continue »220 Excel Tips, Tutorials, Templates & Resources for You [Celebrating 20k RSS Members]
![220 Excel Tips, Tutorials, Templates & Resources for You [Celebrating 20k RSS Members]](https://img.chandoo.org/l/220-excel-tips-tricks-templates-resources.png)
I have an exciting news & massive post for you.
Chandoo.org reaches 20,156 RSS Subscriber mark on Jan 19, 2011As of Jan 19, 2011, our little blog has registered our 20,000th RSS Subscriber. While this is not a huge achievement or anything, It certainly calls for celebration. I am so happy to see our mission to make people awesome in Excel is reaching out to more people everyday. Thank you.
To celebrate this milestone, I am doing a massive post with 220 Excel tips, tricks, tutorials & templates.
Formulas [52 tips]
Formatting & Conditional Formatting [36 tips]
Charting [60 tips]
Tables & Pivot Tables [15 tips]
Using Excel [47 tips]
Free Downloads [5 tips]
Recommended Resources [5 tips]
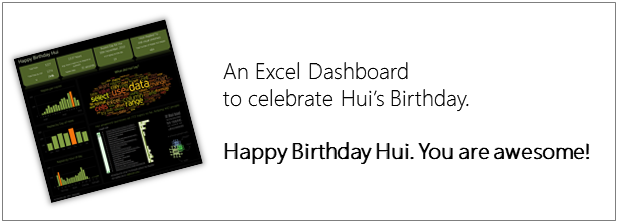
Happy Birthday Hui, An Excel Dashboard to prove you are awesome!

Some of you know our guest author and Excel ninja Hui. Yesterday was his birthday. And I wanted to create nice birthday gift for him. So I took a database dump of our forums data and created a dashboard.
Read rest of this post to see the dashboard & download workbook.
Continue »How to Embed Youtube videos in to Excel Workbooks?

Often, while creating a complex model or dashboard, you may want to include additional training material in the workbook. So let us learn how to embed flash movies, Youtube videos etc. in to Excel workbooks.
To Embed Flash Movies, Youtube Videos in to Excel, follow these steps.
Continue »Using Array Formulas to check if a list is sorted.

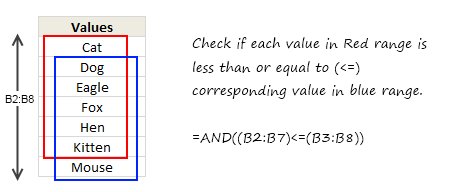
Today, we will learn an interesting array formula trick to test if a list is sorted or not. During last one week, I got 2 requests from different clients for some excel related work. Both of them had one thing in common. To test whether a list is sorted or not. So I got thinking, […]
Continue »Do you want to Learn Excel? Consider Joining Excel School
As you may know, I run an online Excel training program called as Excel School. So far, I have conducted 3 batches of Excel School training and now on January 12th I am opening registrations again for new students.
In this post, I am going to share few important details about the program and give 3 FREE lessons to you. Read on, if you are interested to learn Excel.
Continue »11 Excel Trackers & Templates to help you Rock 2011

We are just a few days away from 2011. New year always brings hope, cheer, joy and revitalizes us. So naturally many of us embark on journeys with new goals, resolutions, things to do.
Naturally, Excel can help us better manage the new year. In this post, I am featuring 11 templates so that you can have a rocking 2011.
Continue »How would you Visualize World Education Ranking Data [Homework + Video]
![How would you Visualize World Education Ranking Data [Homework + Video]](https://chandoo.org/img/vp/world-education-scores-excel-chart.png)
Here is a charting challenge to begin your Christmas week. Recently Guardian’s Data Blog released World Education Rankings data and a sample visualization. Now your challenge is to make your chart visualizing World Education Rankings data.
You can see the chart I have constructed above. Read the rest of the post to find out how I made this chart and download the workbook.
Post your submissions using comments.
Continue »![2011 Calendar – Excel Template [Downloads]](https://img.chandoo.org/c/2011-calendar-template-download.png)
Here is a 2011 new year gift to all our readers – a free 2011 calendar template.
(a little secret: just change the year in worksheet “Full” from 2011 to 2012 to get the next year’s calendar. It works all the way up to year 9999)
You can add notes to individual dates or complete month using the excel template very easily. There are 6 different calendar templates in the download file,
* 4 Yearly Calendar Templates with different color schemes.
* 1 Mini Calendar
* 1 Monthly Calendar (prints in 12 pages)
Go ahead and download the calendar files. Enjoy.
Continue »6 Christmas Cards in Excel – Download and Spread Joy

Few days back, I have asked you to make a Christmas card in Excel (or any of your favorite festival’s card).
We got 6 entries for this contest. All the entries showed a lot of creativity to come up with beautiful cards using Excel. See the entries, download the excel files & find out who the winner is. Read the rest of this post.
Continue »Make Dynamic Dashboards using Pivot Tables & Slicers [Video & Download]
![Make Dynamic Dashboards using Pivot Tables & Slicers [Video & Download]](https://chandoo.org/img/dashboards/dynamic-excel-dashboard-using-pivot-slicers-demo.png)
Do you know that Excel 2010 makes creation of dynamic dashboards very simple?
Yes, that is right. Using slicers feature, you can create dynamic excel dashboards from your data in very little time. Today we are going to learn a technique that will help you create a dashboard like below.
Read rest of this post to find out how to construct a dynamic dashboard in Excel & download the example workbook.
Continue »Merge Cells without Losing Data [Quick Tip]
![Merge Cells without Losing Data [Quick Tip]](https://chandoo.org/img/vba/merge-cells-without-loosing-values.png)
Many of us face this problem. We have some data in a few cells. Either for alignment or structure, we would like to merge the cell contents in to one big cell. But Excel wont help as it cannot merge values from all cells.
Continue »Excel Animation without Macros!
Today we will learn an interesting animation technique that ONLY uses, … wait for it …, Excel Formulas. That is right, we will use simple formulas to animate values in Excel.
Intrigued? Confused? Interested?
First see a short demo of excel animation achieved using this technique.
Now read the rest of this post to learn more about this technique and download sample workbook.
Continue »An Excel Dashboard to Visualize 10,007 Comments [Dashboard Tutorial]
![An Excel Dashboard to Visualize 10,007 Comments [Dashboard Tutorial]](https://chandoo.org/img/vp/10007-comments-dashboard-thumb.png)
First some good news, On 21st November, 2010, our little blog received its 10,000th comment!
Thank you so much for making this happen.
Those of you reading chandoo.org for a while know my penchant for comments. I have learned a lot of excel tips & ideas just by reading the comments you posted on this blog. I think comments are one of the best parts of this blog. So, naturally, I wanted to celebrate this milestone, with something big & awesome.
My intention was to download all the 10,000+ comments and play with the data to come up with something outstanding, like a dashboard. It took me 2 days to conceptualize and create this beauty.
Continue »VLOOKUP Formula Cheat-sheet – FREE Download

We have talked a lot about VLOOKUP and other lookup formulas recently during VLOOKUP Week.
In this post I am giving away a free VLOOKUP formula cheat-sheet for our readers. This cheat-sheet is prepared by Cheater John specifically for our readers. I hope you enjoy the one page help on VLOOKUP.
Continue »

