All articles with 'custom cell formatting' Tag
Automatically Format Numbers in Thousands, Millions, Billions in Excel [2 Techniques]
![Automatically Format Numbers in Thousands, Millions, Billions in Excel [2 Techniques]](https://chandoo.org/wp/wp-content/uploads/2024/07/SNAG-0072.png)
Ever wanted to automatically format values in thousands, millions or billions in Excel? In this article, let me show you two powerful techniques to do just that.
Continue »CP031: Invisibility Tricks – How to make things disappear in Excel?

Podcast: Play in new window | Download
Subscribe: Apple Podcasts | Spotify | RSS
In the 31st session of Chandoo.org podcast, let’s disappear.
What is in this session?
Spreadsheets are complex things. They have outputs, calculation tabs, inputs, VBA code, from controls, charts, pivot tables and occasional picture of hello kitty. But when it comes to making a workbook production ready, you may want to hide away few things so it looks tidy.
That is our topic for this podcast session.
In this podcast, you will learn
- Quick announcements first anniversary of our podcast etc.
- Hiding cells, rows, columns & sheets
- Hiding chart data points
- On/off effect with form controls, conditional formatting
- Making objects, charts, pictures disappear
- Disabling grid-lines, formula bar & headings
- Hiding things in print
Convert fractional Excel time to hours & minutes [Quick tip]
![Convert fractional Excel time to hours & minutes [Quick tip]](https://img.chandoo.org/q/convert-fraction-to-hours-minutes-in-excel.png)
Time for another quick Excel tip.
Lets say the park near your house rents tennis courts by hour. And they charge $10 per hour. At the end of an intense tennis playing week, Linda, the tennis court manager called you up and said you need to pay $78 as rent for that week.
How many hours did you play?
Of course 78/10 = 7.8 hours.
But we all know that 7.8 hours makes no sense.
We also know that 7.8 hours is really 7 hours 48 minutes.
So how to convert 7.8 hrs to 7:48 ?
Continue »There are Easter Eggs in this Excel file!!!

Hello Friends…,
It is Easter time again. Every year, we at Chandoo.org celebrate Easter by hunting for eggs (not in the wild, just in the Excel workbooks). This year too I have hidden 30 Excel tips in a workbook. You have to solve 3 puzzles to find them. So what are you waiting for. Go ahead and hunt for them eggs.
Click here to download the Easter eggs file.
I am sure you will enjoy them 🙂
Continue »Multiplying 24ft 9inches with 6ft 3inches using Excel
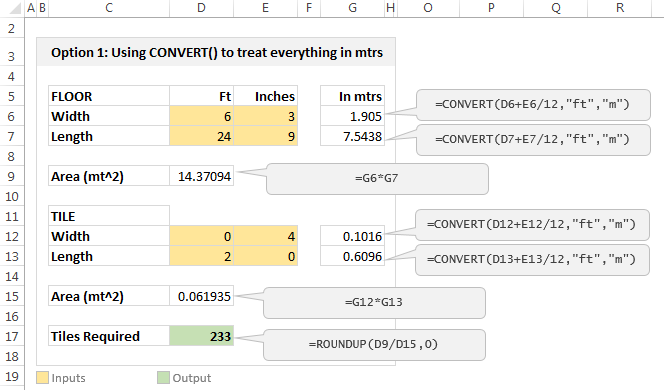
Imagine you are a carpenter and you are tasked with laying wooden floor at Gill Bates’ house. Now Gill B has a very big house and he wants to make sure you do a good job. So instead of asking you to lay the floor for entire house, he asks you to finish flooring in the guest bedroom first. Here are the dimensions of that guest bedroom.
- Width: 6ft 3inches
- Length: 24ft 9inches
- Size of individual wooden floor board: 2ft x 4inches
And here is the big question you are facing.
What?!? the guest bedroom width is only 6ft 3inches?
But over the years of chiseling and polishing you have learned to keep quiet and do your work.
So the real question you have is, How many wooden floor boards should you buy?
Of course, you want to find the answer using Excel. Why else would a carpenter read this blog?
Continue »Quick and easy Gantt chart using Excel [templates]
![Quick and easy Gantt chart using Excel [templates]](https://img.chandoo.org/pm/quick-gantt-chart-template-excel.png)
Gantt charts are a very popular way to visually depict project plans. Today, let us learn how to use Excel to make quick & easy Project Plan Gantt Chart.
This is what we will be creating.
Continue »Combine pie and xy scatter charts – World Polls chart revisited
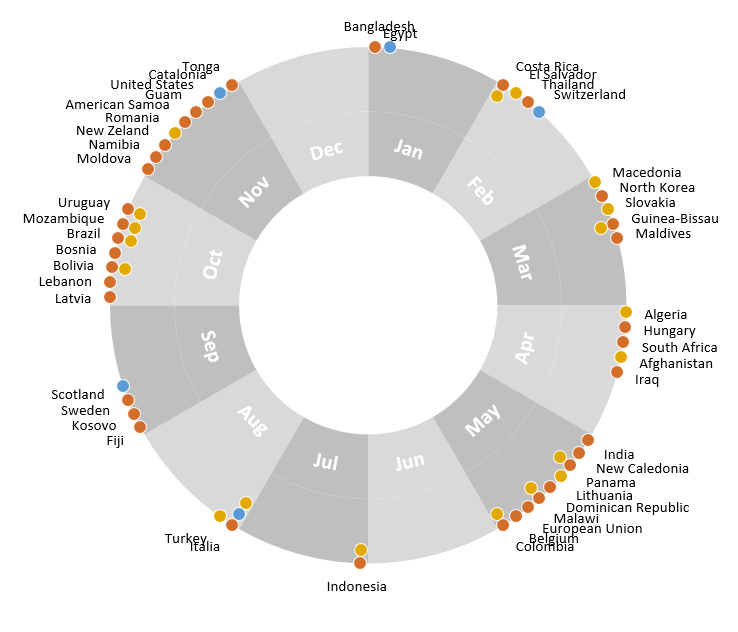
Few days ago, we learned how to create a pie+donut combination chart to visualize polls around the world in 2014. It generated quite a bit of interesting discussion (47 comments so far). One of the comments was from Roberto, who along with Kris & Gábor runs The FrankensTeam an online library of advanced Excel tricks, charts and other mind-boggling spreadsheet wizardry.
I really liked Roberto’s comments on the original post and a charting solution he presented. So I asked him if he can do a guest post explaining the technique to our audience. He obliged and here we go.
Over to FrankensTeam.
Continue »Never use simple numbers in your dashboards (bonus tip: how to fix default conditional formatting)
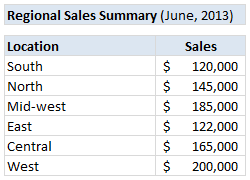
Pop quiz: What is wrong with above report?
At first glance, it looks alright. But if you observe closely, you realize that it is not telling the entire story. Just looking at regional sales numbers, you have not much clue what is going on with them.
So how to improve it?
Continue »![Show Decimal Points if needed [Quick Tip]](https://img.chandoo.org/q/general-formatting-in-excel.png)
Sometimes you want to turnoff decimal points if the value after point is 0. Mireya, Chandoo.org member had one such situation. She writes:
I am a complete beginner in excel, how can I keep the zeros when I am working with decimals and remove them when are not required.
This is where we can use General formatting. Read on to learn how General formatting works and what to do in extreme cases.
Continue »After a long time, I am writing one more Excel links post. First let me share a quick personal update.
I am invited to Lome, Togo to spend a day at Ecobank – CFO conference in 3rd week of September. I will be conducting a one day masterclass on Advanced Excel & Dashboard Reporting. I am excited about this trip as I have never been to any African country. I will post some pics and tell you how it went once I am done with the conference.
Moving on to Excel Links for today,
Continue »Use Text Format to Preserve Leading Zeros in Excel [Quick Tip]
![Use Text Format to Preserve Leading Zeros in Excel [Quick Tip]](https://img.chandoo.org/q/apply-text-formatting-to-preserve-leading-zeros.png)
Here is a quick tip to add awesome to your Wednesday.
If you want to enter numbers like 00023 or 023.340 or 23.34500 in your Excel sheet, you would notice that Excel magically removes leading zeros and trailing zeros (after decimal point) as the number 23 is same as 00023. But sometime, we want 00023, not 23. Then what?!?
Very simple, we use TEXT format instead of number format. Just select the cells where you are going to enter these numbers, and from Home ribbon > Number area, select “Text” as cell type. This tells Excel to treat any value you enter as Text, not as number. So when you type 00023, it will appear as 00023.
Continue »Christmas Gift Shopping List Template – Set budget, track your gifts using Excel
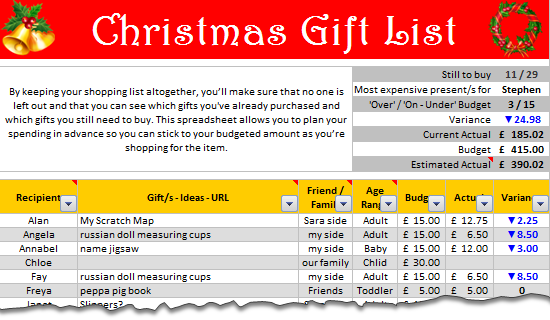
Last year, Steven shared a beautiful Christmas Gift List template with all of us. It is packed with lots of Excel goodness. Just a few days ago, he emailed me another copy of his file with some improvements. So if you are planning for Christmas shopping and want a handy tracker, you don’t want to miss this.
Continue »Thanks half a million… (and 2 excel tips)

I have a happy news to share with you!!! For the first time since starting this website, we got 500,000 + page views in the month of September 2010. Half-a-million! Thank you so much. To put this in context, in Sept 2009, we got 245,000 views. Traffic grew by more than 100% in last 12 […]
Continue »August 2010 – Best Month Ever (and 2 charting tips inside)

Time to stop everything we do and celebrate, for, our little community at chandoo.org had the most fantastic, awesome month ever.
That is right. August 2010 has been the best month since I started chandoo.org. We have broken a majority of previous records in terms of conversations, connections, content and revenues.
In August, we had 17 posts, with 604 comments. We had 178,000 visitors reading 453,000 pages. Our RSS subscriber base grew to 11,917 (it was 5738 an year ago). August has been the best month in-terms of revenues too. We sold highest number of project management templates & excel formula e-books since launch. We had a stellar launch for wedding planner with 22 customers.
Read rest of this post to find statistics about chandoo.org and get 2 charting tips.
Continue »How to show Indian Currency Format in Excel?

This is a guest post by our excel ninja – Hui. Today we will learn how to format numbers and amounts in Indian currency format. Indian numbers are grouped differently than standard English numbers. English Grouping 123,456,789.01 Indian Grouping 12,34,56,789.01 Quick and easy fix to show numbers in Indian format: A custom number format of: […]
Continue »

