
Time to stop everything we do and celebrate, for, our little community at chandoo.org had the most fantastic, awesome month ever.
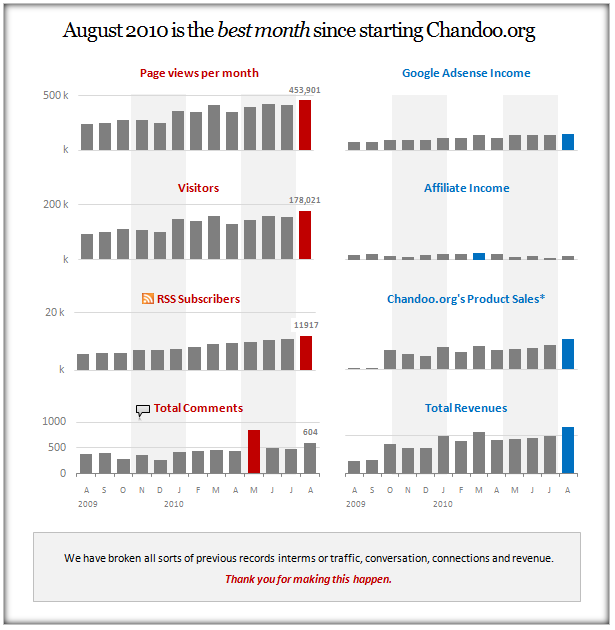
That is right. August 2010 has been the best month since I started chandoo.org. We have broken a majority of previous records in terms of conversations, connections, content and revenues.
In August, we had 17 posts, with 604 comments. We had 178,000 visitors reading 453,000 pages. Our RSS subscriber base grew to 11,917 (it was 5738 an year ago). August has been the best month in-terms of revenues too. We sold highest number of project management templates & excel formula e-books since launch. We had a stellar launch for wedding planner with 22 customers.
Personally too the month had been exciting. I learned how to drive a car without damaging much property or messing with pedestrians. Our kids started walking for the first time and we had hilarious moments watching them and playing with them. I used the occasion to record 10 videos to help you take baby steps in to excel world.
All the credit for website success goes to you. You have been awesome by sharing, connecting, commenting, learning, buying and emailing. Without you, this success means little to me. Thank you so much.
We dont have best months every now and then. The last time we did was in Jan 2010. So, to celebrate this occasion, I have created a small poster showing all the vital statistics for last 13 months. After all, today is a Friday, time to loosen up and get ready for the weekend.
PS: I have removed the labels from financial info. But, you can safely assume that Chandoo.org has been keeping both my mind and pocket happy.
* I have ignored Excel School revenues due to seasonal nature of it.
Some observations:
- Traffic has gone up since Jan 2010, may be due to increased word of mouth?!?
- We got 850 comments in May, 2010 due to 2 personal updates – I quit my job to become full time entrepreneur and we replaced Pointy Haired Dilbert with Chandoo.org
- Google adsense income has been growing steadily.
- Affiliate income (money I get when I recommend someone’s products) has been low in the last few months. I removed a few ads and reduced the frequency of my reviews.
- My own product sales have been extremely encouraging. Between PM Templates, Formula e-book and Wedding planner, we had almost 1000 customers in the last 13 months. Thank you.
- Excel school has been best seller too. We have trained a total of 350 students in first 2 batches.
Bonus Charting Tips
It doesn’t feel alright to just navel gaze on a bright, beautiful day like today. So here we go with 2 charting tips:
1. Use 13 months as the horizon in time-series charts: Well, the reasoning is simple. While the last 12 months data gives you trend, same month, last year’s data should tell you how well / how bad you are doing YoY. So, try using 13 month window instead of 12 in time-series charts.
2. Use MMMMM format to show first letter of month: If you have dates in the x-axis, you may want to abbreviate them to de-clutter the chart. Use the custom format code MMMMM (that is right, it is 2 and half M&Ms) to show the first letters of months.
That is all.
Thank you once again
Thank you so much. You constantly inspire me to learn and share whatever I can. Thank you.


14 Responses
wow, nice panel charts!
like how the vertical bands “cut” across the charts/panels. but strangely, it doesnt highlight the proper Quarter breakdown (Q1=Jan-Mar, Q2=Apr-Jun, etc).
a tutorial for these charts?
thanks!
Your chart gives the visual impression that affiliate income is your biggest source of income. That’s a danger of scaling each panel separately.
@David: this is not a business chart you see in wsj. I just highlighted alternative 3 months to make it easy to read.
@Naomi: well, this is not a panel chart either. It just so happened that the charts are aligned like that. If I am making 400,000 $s selling affiliate products, you know what I would be doing…
Thanks so much for the fantastic tips. I’ve printed so many pages for my paper based backup file. Congratulations!
Congratulations! Also thank you for the tips.
I have a simple question. On your panel charts, how do you grey out the sets of alternating 3 months? I always struggle to know what to do with the vertical lines in a chart background. I like that simple look.
Thanks again.
@Tyler… It is much more simpler than it looks. What I did is,
(1) Remove fill colors from plot area, chart areas for all the charts. Now the charts are transparent.
(2) Now, create a block of dull gray shade using drawing shapes
(3) carefully position it behind the chart (use right click > send backwards option)
(4) clone the thing and repeat.
I create the best of month posters once in a while. So I made a template for that. (well, I am optimistic and hope to use it often).
@Servaas: You are welcome buddy. 🙂
@Chandoo! That is a lot simpler than what I assumed. I figured there was a hidden menu to format the background automatically based on a date range or something. Sometimes I make things too hard.
@Tyler: Well, there is a more roundabout, but dynamic way to do it. Here is a tut: http://chandoo.org/wp/2009/08/27/dynamic-event-grouping-in-charts/
Chandoo,
Congrats on all the success. It is very inspiring and it feels great to know that you are doing so well, although it should be expected as this is the single greatest resource for people looking to become Excel masters.
I can’t thank you enough. My skills have increased dramatically, my boss is impressed everyday and I almost brought him to tears with a dashboard that I created for him, (using the things I have learned here). I am starting my own company and building spreadsheets for customers within my industry and I hope to one day have the success that you have had.
Much love.
Congratulations on your success with Chandoo.org! I can’t even imagine the time and effort it takes to create the content you share. While your stats show Page Views and revenues for Chandoo.org, you have no idea of how many “Page Views” you have contributed to, based on the Excel Skills that you have helped me to develop.
There’s hardly an Excel view that I create that doesn’t have a footnote reference “As Seen on Chandoo.org”…
@all.. based on Naomi’s comments, I have made the scale uniform for financial information charts (all the 4 on right). Now you can see the relative performance of each of the various segments. I removed the axis labels and scale info. as with earlier chart.
@Perry and Charlene: Thank you so much. I feel very happy knowing that you are getting success and fame applying what you learn.
What !! – 22 Wedding Planner customers. Oh , them poor husbands to be (lol). I suppose the Planner will at least help (hopefully) reduce the arguments.
All said in jest of course from happily married man of 13 years.
Hi Chandoo. You deserve the success. I find this site very helpful. In fact every time I need something done in Excel, I consult your tips and I get the result I want. Thanks again for sharing your awesome ideas and skills!
@Drew… You are welcome 🙂