All articles with 'no ads' Tag
Wow, what a month it has been. In August 2015, I announced Awesome August, an Excel festival. I published 31 articles, one for each day of August to make you awesome in your work. We had 3 podcasts, 11 videos, 17 articles and 238 comments in August. This content is consumed by more than 50,000 people from all over the world (3% of site traffic visited Awesome August pages). There were lots of emails, tweets and facebook posts telling me how you are enjoying Awesome August.
Thank you so much for taking time to learn from Chandoo.org and making Awesome August a success.
I made a short (5 mins) video to share the journey and to say thanks to you personally. Please watch it below.
Continue »Are you an analyst? Use these 25 shortcuts & tricks to boost your productivity

Analyst’s life is busy. We have to gather data, clean it up, analyze it, dig the stories buried in it, present them, convince our bosses about the truth, gather more evidence, run tests, simulations or scenarios, share more insights, grab a cup of coffee and start all over again with a different problem.
So today let me share with you 25 shortcuts, productivity hacks and tricks to help you be even more awesome.
Continue »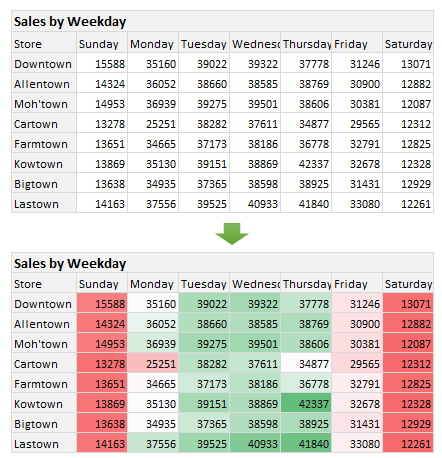
Here is a situation all too familiar.
You are looking at a spreadsheet full of data. You need to analyze and tell a story about it. You have little time. You don’t know where to start.
Today let me share 15 quick, simple & very powerful ways to analyze business data. Ready? Let’s get started.
Continue »Share your favorite Excel tip & you could win Beats Headphones [Podcast Anniversary Celebrations]
Yay, bring out the birthday hats, candles, cake & confetti. Chandoo.org podcast is 1 year old.
In this one year, we had 31 sessions, 4 guest appearances, 390,000 downloads & lots of 5 star reviews. Thank you so much for making it a grand success so far.
To celebrate the occasion, I want to reward 3 lucky listeners of our podcast.
How to participate in this contest?
- Simple. Figure out what your favorite Excel tip is.
- Open your smart phone’s voice recorder app
- on iPhone use the Voice Memos app
- on Andriod use sVoice or voice recorder widgets
- If you cant find these apps, just Google record audio <your phone name>
- Record the tip (less than 3 mins duration)
- Please say your name at the end of recording.
- Send the audio file by email to hello@chandoo.org
- Do so before end of day 16 March 2015 (Monday)
Once I collect all the tips, I will feature some of them in next episode of Chandoo.org podcast.
Continue »2 Must watch Excel webinars for you
Just a quick announcement.
As you may know, I will be speaking at PASS Business Analytics conference in Santa Clara this April (between 20th & 22nd). As a run up to the event, the good folks at PASS are conducting free webinars on various topics of Excel.
Here are 2 topics on which I am doing webinars. You can watch them and pick up some really cool Excel skills. Just click on below links to enjoy them.
- 5 Dashboard mistakes to avoid (watch it any time)
- Excel charting – productivity tips (live on February 3rd)
That is all for now. See you in the webinar.
Continue »3 Course Meal of Excel Awesomeness for You

If you are an Excel enthusiast, here is a feast for you.
Just a small glitch, it is a not feast you enjoy with mouth, it is a feast you consume with eyes, ears & mind.
It gives me immense pleasure to invite you to this feast.
Continue »Download today – Introducing Excel Dashboard Templates from Chandoo.org
Friends and readers of Chandoo.org, my newest download, Excel Dashboard Templates are available for your consideration. Click here if you are ready to get them. Read on to know more.
What are Excel Dashboard Templates?
As the name suggests, these are ready to use Excel templates for creating awesome, informative, easy to understand & quick dashboards with your data. You just enter your data, set up few calculation options, decide how your dashboard should look & bingo, a beautiful & insightful dashboard will be created for you. These dashboards are optimized to look great, convey key information & prompt correct action.
Who should buy these templates?
Analysts, managers, reporting professionals, business owners & executives. These templates are designed to help anyone preparing Excel based dashboards, scorecards or KPI reports.
Benefits for you
- Design awesome dashboards in minutes, not months: Don’t waste hours trying to figure out formulas, chart settings and layouts. Instead focus on what your users want, how your business works and use those insights to tell the ‘Excel Dashboard Template’ what you want. Save time and look awesome.
- Accommodate change elegantly: People change. Businesses change. What your boss wanted last month is no longer what she wants today. So when someone asks you, “hmm, can you show me YTD data instead of last 13 months”, or “Can I see top 10 KPIs instead of all”, you just smile and tap a few clicks and bingo, the new dashboard will be ready. These templates are designed to handle change (data, requirements, design preferences and insights).
- Beautiful & Informative: These templates are designed with a delicate balance of beauty & insight. Everything is seamlessly designed, perfectly aligned and precisely calculated so that you & your boss can focus on the insights & decisions. Time tested and well honored visualization principles & guidelines are observed thru-out the reports.
- Built for starters, built for pros: Whether you are just starting with Excel or a seasoned pro, you can find the templates right up your alley. For advanced users, we have many customizations to whet your appetite. Want to build a custom calculation or include another type of sorting, you can do it by tinkering with ‘calculations’ sheet.
Hello folks,
Its almost ready. Our ready to use Excel dashboard templates are coming to a spreadsheet near you on November 13th.
Here is a teaser preview of the dashboards. Our own official trailer, rated A for awesome.
Watch it below:
http://youtu.be/2-TvjpEKf-o
(see it on our YouTube Channel, alternative link)
Excel Dashboard Templates – What are they?
As the name suggests, these a set of workbooks where you can key in your data, set up how you want the looks & bam, a beautiful, insightful, fun, easy to use dashboard pops right out. All in few minutes.
Here is how these templates can help you:
- Design awesome dashboards in minutes, not months: Don’t waste hours trying to figure out formulas, chart settings and layouts. Instead focus on what your users want, how your business works and use those insights to tell the ‘Excel Dashboard Template’ what you want. Save time and look awesome.
- Accommodate change elegantly: People change. Businesses change. What your boss wanted last month is no longer what she wants today. So when someone asks you, “hmm, can you show me YTD data instead of last 13 months”, or “Can I see top 10 KPIs instead of all”, you just smile and tap a few clicks and bingo, the new dashboard will be ready. These templates are designed to handle change (data, requirements, design preferences and insights).
- Customize everything: Unlike a template set in stone, these are designed to let you customize almost every little aspect of the output, calculations and behavior.
- Beautiful & Informative: These templates are designed with a delicate balance of beauty & insight. Everything is seamlessly designed, perfectly aligned and precisely calculated so that you & your boss can focus on the insights & decisions. Time tested and well honored visualization principles & guidelines are observed thru-out the reports.
- Built for starters, built for pros: Whether you are just starting with Excel or a seasoned pro, you can find the templates right up your alley. For advanced users, we have many customizations to whet your appetite. Want to build a custom calculation or include another type of sorting, you can do it by tinkering with ‘calculations’ sheet.
What would you wear to an Excel themed Halloween party?
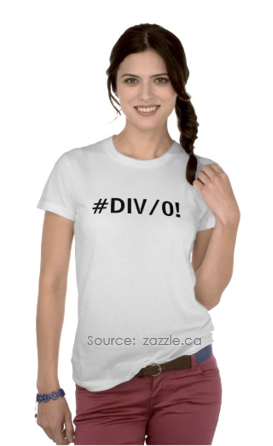 Its Halloween time. So humor me and imagine that Bill Gates invited you to his castle for an Excel themed party.
What costume would you wear?
Go ahead and tell me in the comments.
I will go first:
I would dress up as a spider (radar) chart. All I need is some cob webs on my regular dress.
Your turn…
Continue »Please help me design our new course – “50 ways to analyze your data”

Hi friends & readers of Chandoo.org,
I have an exciting and awesome new training program for you. 50 ways to analyze your data is aimed to give you critical data analysis & charting skills necessary for your success as an analyst (or manager). I want to make sure that this course offers you best content & value. I need your help in designing it. Please take a few minutes to read this short post & share your feedback.
Continue »Teach me (and rest of our community) something this Teachers’ Day

Today is teachers’ day in India. I owe everything I learned to my teachers. Their powerful, insightful & inspirational lectures make me a better person.
Today I want to recruit more teachers. Because you never learn enough.
So why don’t you come on board and teach me (and rest of website visitors) something?
All you have to do is post a comment with an Excel tip, technique, idea or experience with us. It can be related to anything, from formulas to solver, charts to power pivot, VBA to keyboard shortcuts. Anything goes.
Lets go. I am all ears.
Continue »Become awesome in data analytics, charting & Power Pivot with Houston Masterclass [reminder]
Hello friends,
Let me stop our broadcast of Excel tips to bring an announcement.
Houston, we are going to get awesome

As you may know, I am doing 4 days of live masterclasses on Advanced Excel, Dashboards, Power Pivot & Data Analytics in Houston (Texas) this September.
- 15 & 16 September (Mon & Tue) on Advanced Excel & Dashboard Reporting
- 17 & 18 September (Wed & Thu) on Power Pivot & Data Analytics
This 4 day masterclass is aimed at managers, analysts, reporting professionals, executives in sales, marketing, customer service or anyone who wants to learn about Data Analytics, Advanced Excel, Dashboard reporting.
Please click here to know more.
Continue »Come join me at Excelapalooza conference in Dallas or Masterclass at Houston this September

If you listen carefully, you can hear my screams of joy. I have 2 very happy news to share with you.
- I am speaking at Excelapalooza Excel conference, happening at Dallas (Texas) between September 21 to 24.
- I will be conducting an Advanced Excel, Dashboards & Power Pivot masterclass at Houston (Texas) between September 15 to 18.
Vote for your favorite US state migration dashboard
They are here! the shortlisted 12 entries of our dashboard contest for 2014 are here.
Please take a minute to review the entries and cast your vote. Click here.
Go ahead and cast your vote. Online voting for your favorite entries closes at midnight on 25th June, Wednesday (2014), Pacific time.
Continue »Top 10 things we struggle to do in Excel & awesome remedies for them

Recently we asked you, what do you struggle doing in Excel? 170 people responded to this survey and shared their struggles. In this post, lets examine the top 10 struggles according to you and awesome remedies for them.
Continue »


