All articles with 'Learn Excel' Tag
Write a formula to check if two dates are in same month? [homework]
![Write a formula to check if two dates are in same month? [homework]](https://img.chandoo.org/hw/check-two-dates-in-same-month-excel-homework.png)
Its Home work time folks. Sharpen your Excel pencils and get cracking.
Find out if 2 dates are in same month
Lets say you have 2 dates in A1, A2.
Q1. What formula tells us if both of them are in same month?
Both dates must be in same month & year!
Go ahead and post your answer in comments.
Continue »Journey of Hurricane Sandy – Animated Excel Chart

Hurricane Sandy has taken front seat in all major news channels, papers, websites even in far off places like India. I hope & pray that our readers in US East coast are safe.
Today, lets understand the journey of Hurricane Sandy in this animated chart, prepared by Chris from Excel365.
Continue »Designing a Project Portfolio Dashboard [Part 1 of 2]
![Designing a Project Portfolio Dashboard [Part 1 of 2]](https://img.chandoo.org/pm/project-portfolio-dashboard-mockup.png)
In this 2 part tutorial, we will learn how to design a project portfolio dashboard. Part 1 will focus on user needs & design. Part 2 on Excel implementation.
Background
As you may know, we sell a set of Excel Project Management templates. These templates help plan, track, manage & report a project right from Excel.
While these templates good, they have one limitation. They work for one project at a time. Many customers have asked me if I come up with a project portfolio dashboard that can tell what is going on in a set of projects in one view.
And that is where we begin.
Continue »Even faster ways to Extract file name from path [quick tip]
![Even faster ways to Extract file name from path [quick tip]](https://img.chandoo.org/f/extract-by-find-replace-demo.gif)
The best thing about Excel is that you can do the same thing in several ways. Our yesterdays problem – Extracting file name from full path is no different. There are many different ways to do it, apart from writing a formula. Learn these techniques to be a data extraction ninja.
1. Using find replace
2. Using text to columns
3. Using UDFs
Extract file name from full path using formulas

Today lets tackle a very familiar problem. You have a bunch of very long, complicated file names & paths. Your boss wants a list of files extracted from these paths, like below:
Of course nothing is impossible. You just need correct ingredients. I cannot help you with a strong cup of coffee, so go and get it. I will wait…
Back already? well, lets start the formula magic then.
Continue »Please help me design our new product: Vitamin XL

Hello friends, fans & well wishers of Chandoo.org,
I am happy to announce about our new product – Vitamin XL, a membership program for you. I want to make sure that Vitamin XL offers you the best possible features & value. I need your help in designing this product. Please read this short article and give me your feedback.
What is Vitamin XL?
Just like vitamins you give you strength and health, Vitamin XL ups your Excel mojo, gives you new ideas & powers. Here is what I have in mind:
Vitamin XL is a membership program with 3 distinct benefits
- Excel Training
- Excel Resources
- Excel user community
Last day to join Excel School + Excel Hero Academy
As you may know, I have partnered with Daniel Ferry to offer an irresistible bundle of Excel goodness: Excel School + Excel Hero Academy.
Today is the last day to enroll in this combined program. More than hundred eager & enthusiastic bunch of participants have already joined us. As you read this, there are dozens of people becoming awesome in Excel.
If you have been waiting to enroll, now is the time.
Continue »Write a formula to check few cells have same value [homework]
Lets test your Excel skills. Can you write a formula to check few cells are equal?
Your homework:
- Let us say you have four values in cells A1, A2, A3, A4
- Write a formula to check if all 4 cells have same value (ie A1=A2=A3=A4)
- Your output can be TRUE/FALSE or 1/0 to indicate a match (or mis-match)
Use Indexed charts when understanding change [Charting Techniques]
![Use Indexed charts when understanding change [Charting Techniques]](https://img.chandoo.org/c/example-indexed-chart-in-excel.png)
Today, lets talk about indexing, a technique used to compare changes in values over time.
What is indexing?
Lets say you want to compare prices of Gold & Coffee over last few years. Gold price in 2011 (oct) is $1,655 per ounce. And now (sept 2012) it is $1,744. Like wise, Silver price in 2011 is $32.06 and in 2012 it is $33.61. How do we compare such diverse numbers?
Enter indexing.
First we need to calculate price of Gold and Silver in 2012 assuming their starting price is 100. This can be done with simple arithmetic.
Now, we can easily compare the prices. Looking at the indexed prices, we can conclude that both Gold & Silver prices have gone up by similar percentage (~5%).
Continue »Excel Formatting Tips – Gangnam Style [open thread]
![Excel Formatting Tips – Gangnam Style [open thread]](https://img.chandoo.org/f/excel-formatting-gangnam-style.jpg)
Ever seen a glaring, over the top, wow-I-am-sooo-cool type of spreadsheet? Lets call them Gangnam spreadsheets!
Gangnam what?!?
If you have never heard about Gangnam style, do not worry. Just like you I too was living under a rock for about a week ago. Then I watched the awesome Gangnam style song. And now I am hooked. You can see it here.
What has all this got to do with Excel?
Oh I am coming to the point. One of the key ingredients of being awesome in Excel is,
To make our Excel workbooks communicate best by avoiding over the top formatting, unnecessary bells & whistles and focusing on what our users want.
But Excel being a feature rich software, it does have various so called Gangnam styles – superfluous 3d effects, formatting options, charting choices and as such.
Today, lets talk Excel formatting – Gangnam style
Continue »Formula Forensics No. 030 – Extracting a Sorted, Unique List, Grouped by Frequency of Occurrence

Today at Formula Forensics, Guest author Sajan shows us how to extract a sorted, unique list of items, displaying the most frequently occurring items first, while restricting the output based on some additional criteria.
Continue »
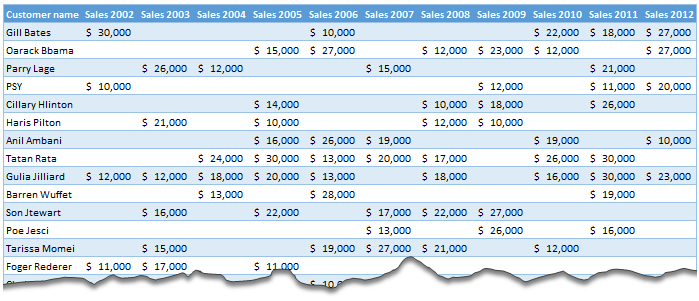
Moosa, one of our readers emailed this interesting question:
I have huge list of customers (around 1500).
Table includes following information
Customer # , Customer Name, Sales 2002, sales 2003, … sales 2012My requirements are
1. list of customer who did not have sales during all these years
2. List of customer who have not business from 2003
3. List of customer who have not business from 2004
Today, lets learn how to identify all the non-performing customers.
Continue »18.2 Tips on Rounding numbers using Excel Formulas

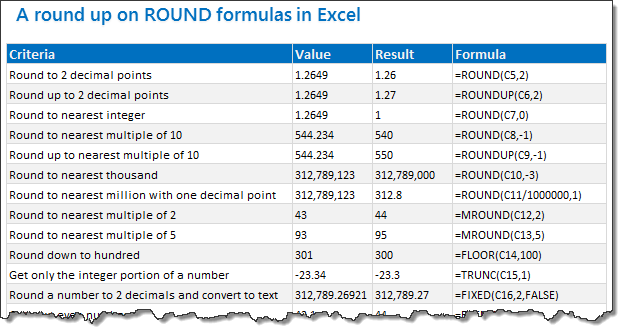
Lets talk round numbers today.I have 18.2 tips for you on round numbers.
We can use a variety of formulas to round numbers in Excel depending on the situation. We have ROUND, ROUNDUP, ROUNDDOWN, MROUND, INT, TRUNC, CEILING, FLOOR, FIXED, EVEN, ODD and few more. To know how to use all these formulas and how to round numbers based on any criteria, just read on.
Continue »Introducing Excel School + Excel Hero Academy Bundle
Hello friends & Chandoo.org readers,
I am super-excited to announce an my first joint Excel course with none other than Excel Hero – Daniel Ferry. For the the first time, you get basic, intermediate, advanced & super-advanced Excel + VBA course in one neat package.
I am happy to present Excel School + Excel Hero Academy course bundle for your consideration.
What is this course bundle & How it can help you?
Simply put, this course package is designed to make you 2x awesome in Excel, VBA & Dashboards. Please watch below video to understand how our course can help you.
Continue »Using Excel for Business Analysis by Danielle [Book Recommendation]
![Using Excel for Business Analysis by Danielle [Book Review]](https://img.chandoo.org/books/using-excel-for-business-analysis-book-review.jpg) Business analysis & modeling are new areas where a lot of fresh graduates find themselves when they start work. Unfortunately, this is also an area where there is very little structured information. Thanks to Danielle’s new book, Using Excel for Business Analysis, you can understand the basics of financial modeling, good spreadsheet design & business analysis
Business analysis & modeling are new areas where a lot of fresh graduates find themselves when they start work. Unfortunately, this is also an area where there is very little structured information. Thanks to Danielle’s new book, Using Excel for Business Analysis, you can understand the basics of financial modeling, good spreadsheet design & business analysis
First up, let me congratulate my good friend Danielle for the successful launch of her first book. Today, I want to share my review of this book with you.
Who is this book for?
- You are someone who uses Excel to analyze & model parts of a business,
- You are not sure how to go about it
- You started using Excel in last few years and lack structured approach to spreadsheet design
- You are a fresh MBA hoping to become an analyst
Then this book is for you.
Continue »


