Ever seen a glaring, over the top, wow-I-am-sooo-cool type of spreadsheet? Lets call them Gangnam spreadsheets!
Gangnam what?!?
If you have never heard about Gangnam style, do not worry. Just like you I too was living under a rock for about a week ago. Then I watched the awesome Gangnam style song. And now I am hooked. You can see it below (or here):
My Korean is just as good as my tap dancing – lousy and non-existent. But I can search. As per wikipedia, the song refers to
“Gangnam Style” is a Korean neologism that refers to a lifestyle associated with the Gangnam district of Seoul, where people are trendy, hip and exude a certain supposed “class”. … Psy likened the Gangnam District to Beverly Hills, California, and said in an interview that he intended a twisted sense of humor by claiming himself to be “Gangnam Style” when everything about the song, dance, looks, and the music video is far from being such a high class. In another interview with CNN, Psy added that:
“People who are actually from Gangnam never proclaim that they are — it’s only the posers and wannabes that put on these airs and say that they are “Gangnam Style” — so this song is actually poking fun at those kinds of people who are trying so hard to be something that they’re not.”
[more]
What has all this got to do with Excel?
Oh I am coming to the point. One of the key ingredients of being awesome in Excel is,
To make our Excel workbooks communicate best by avoiding over the top formatting, unnecessary bells & whistles and focusing on what our users want.
But Excel being a feature rich software, it does have various so called Gangnam styles – superfluous 3d effects, formatting options, charting choices and as such.
Today, lets talk Excel formatting – Gangnam style
Some of my favorite Gangnam formatting tips are,
- Using too many tab colors on your excel workbooks [how to do this]

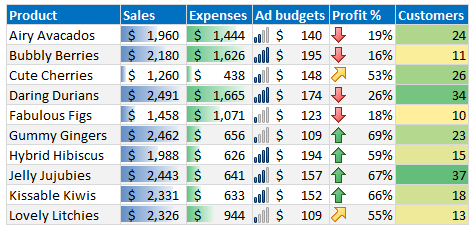
- Overdose of conditional formats

- 3D charting effects [how to do this]

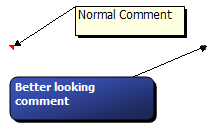
- Comment shapes and formats [how to do this]

- Rotated text

What are your favorite Gangnam formatting tips?
Go ahead and post a Gangnam formatting tip. Lets all make Excel a stylish place. Post using comments.
Bonus: Gangnam style ft. 3 kids & a dad with cam
As you can guess, my kids love the song. So yesterday evening we played the video on TV and they danced. See their awesome steps below (or click here):
PS: Sowmya is my brothers daughter, the other 2 are ours.
PPS: The loud rept(“hehe hahaha”,20) kind of laugh in background is mine!


23 Responses to “Excel Formatting Tips – Gangnam Style [open thread]”
Well, the zoho dashboard provider in the adsense at the top of this post seems to have suggestions aplenty!
- Juanito
I have to admit, I got a little confused. Were these options things we should avoid (such as too many tab colors) or cool things we should use? Or perhaps, just things to use in moderation?
Or perhaps I'm just being too serious for a Friday...one of the "cool" things that Excel does is being able to rotate 3D charts. However, I have no actual use for these as it doesn't convey any useful info. =P
@Luke - doesn’t convey any useful info.
That's the whole point - tempting eye-candy which ends up detracting from the actual content (assuming there is some :))
I call it "Picasso syndrome" to my colleagues here in Spain: Office has all these sexy tools which can make users think they're doing something beautiful or cool when just ain't.
A pet peeve of mine is people drawing thick lines round each data cell, and then using bolder and bigger type. Screaming, man!
- Juanito
I agree with this post in general, and I have little patience for Excel "eye candy" but I have found the rotated text on column headings useful in tight situations from time to time.
Good point @Luke...I'm wondering the same! Do you avoid, or use these (obviously the 3d charts are off limits) 🙂
Ok, I figured out how to do this with Excel 2010. Right click on a cell and insert a comment. Rick click on the cell again and choose 'Edit Comment'. Right click on the black hash lines surrounding the comment box (mouse cursor will turn to a cross). Choose Format Comment.
If you get a tiny box that says ' move here' or 'cancel' keep right clicking until you get a menu. In the menu choose, ‘Format Comment’ and you should see several tabs where you can customize the comment box. After you are done formatting, you can right click again and choose 'Set Auto Shapes Default' if you’d like.
If you have a nifty new comments box you made, and want to apply it to other comments already in your spreadsheet, copy and paste the cell, regardless of data already in the cell, choose 'Paste Special' and choose 'Comments' and other comments will now be formatted with the new design.
I should clarify... The copy and paste feature for comments are if you are using the same comments in different cells within your spreadsheet.
@All.. Obviously, I recommend avoiding gangnam formatting. But they are fun to know, hence this open thread.
I refer to this as High School or School formatting
Where students once exposed to Word or Excel think that 45 different font colors spread across 30 different fonts, with 20 different background colors, makes the formatting look better
Unfortunately some of these people end up in the workplace and bring there habits with them.
My boss is asking me to do something like: "Overdose of conditional formats" how can i do that? Thanks
I'm afraid I am a big fan of colourful formatting, just to brighten up my usually dull work day! I dont do it garish and horrible, usually very co-ordinated and organised. I don't care if it looks a little less professional...Rainbow colours cheer me up!
@Christy
Nice 🙂
Dashboards are quite subjective and at the same time pretty objective. And dint we all hear that We are not grownups until we are childish sometimes. 🙂
"Rainbow colours cheer me up"
That's the only good reason for using so many coulours. 😉
I like all these GangnamStyle elements just to know what I should not do! Fortunately there are a lot of people using them, pimping their charts and tables to make their work a little bit more colourful. But very often they really don't know what they do because they don't know what they want to show with their fancy illustrations.
Excel gives you the chance to creatrevert powerful charts which show your analysis results very good. I you just have to know some tricks. 😉
Happy painting
I think charting is way over rated for many applications. Almost Every time at work someone made a suggestion to chart the budget data I never could format the data to make it meaningful. Visibility was always lost not gained and I lost a lot of time. Now a well designed dashboard is another story.
I am not saying charting is not useful. I just think charting generalizes what one is communicating when it is the details that matter for most reports I work on.
I general rule is if you are trying to communicate details then don't use charting (there are exceptions).
I actually think the whole Illustration tab isGangnam. If you need illustrations then import your excel info into a Word or Power-point not the reverse.
Hi Brian,
I think charting is underrated. You are very right - tables are very good in showing details. But dashboards should not should detail (on the first page). They should show comparisons, relationships, deviations und timelines. And therefore charts are the perfect way. The other point is, that most post people think visualy.
The thing you say "Visibility was always lost not gained and I lost a lot of time" is also very right. I think the reason therefore is, that we don't use the right charts! Excel and all other tools don't provide uesfull charts! You can build good ones when combining different types und using a lot of tricks - e.g. http://www.hichert.com/en/consulting/exhibits/453
My way is: Buildung charts in Excel und paste them to word or powerpoint. Refreshing your data refreshs your slides. Building charts in powerpoint and refreshing your data is quite difficult.
I'm still on 2003, but my nomination would have to be for the chart 'fill effects' - especially 2 colour diagonals!!! Way to make people dizzy when they try to focus on your chart...
Having said that, I have on occasion used the preset 'Daybreak' on some charts just to make the bars stand out against the soft gradation, so possibly, if you were doing plots that went pretty much in a straight line, you could theoretically get some practical value from it. Maybe. Possibly.
PS I've also heard what you call 'Gangnam style' described as 'Circus draft', especially for Word and Powerpoint, but not exclusively.
Hey Chandoo - do we have material for a contest here?
- Juanito 🙂
I think that Chandoo meant: "Go practice your Gangnam moves instead of doing some Gangnam spreadsheet!".
Colours are useful when you are trying to convey flow through a complex spreadsheet. E.g. I have a model that gives me some Activity Based Costing. Each tab is a different colour as it relates to a different activity. When i bring them together in one summary, each tab colour is represented in a column colour... so you can quickly see where it came from. I have also used the same principles when looking at our different factories to help understanding isn't always cool, but it it can be Gagnam Style.
I have to admit, I would agree most of those are glaring, but when column headers are long, what's the alternative to the rotated text on column headers? I'd love to say wrapping text to multiple rows, but often that's not a solution.
Uhh,
just last week, I had to "enjoy" a presentation with 3d - column - charts ... brrr, this is really terrible.
I agree with the reference to hichert, he is - beside Chandoo - great in Charting,
Greetings,
SomeintPhia
Hi,
If you are using colours, in a pie chart - like the horror example from 'Bill the Lizard' or a bar chart - put them in the spectrum order and limit them to the the colour code used in electronics -
Black(0)
Brown(1) [Not actually a spectral colour]
Red(2)
Orange(3)
Yellow(4)
Green(5)
Blue(6)
Violet(7)
Grey(8)
White(9).
Then they are reasonably easy to identify and relate to the subgroup titles - but also think of your readership some might be colour blind.
John