Archive for April, 2014
Calculate CAGR (Compounded Annual Growth Rate) using Excel [Formulas]
![Calculate CAGR (Compounded Annual Growth Rate) using Excel [Formulas]](https://img.chandoo.org/f/calculating-cagr-using-arithmetic.png)
Lets talk about how we can use Excel to calculate Compounded Annual Growth Rate (CAGR for short).
What is CAGR? What does it signify?
Let us say you are the CEO of ACME Inc. You have been selling various widgets since 2009. In your latest annual report you want to tell your shareholder at what rate you have been growing ACME Inc. sales. The figure are,
- 2009 – $150 Mn
- 2010 – $125 Mn
- 2011 – $160 Mn
- 2012 – $174 Mn
- 2013 – $195 Mn
- 2014 – $210 Mn
Now, if you see the growth rates, they are all over the place. Right from -16.67% to 28%. But you want to report a single annual growth rate.
This is where CAGR (Compounded Annual Growth Rate) comes handy.
Continue »![How to become an MVP in Excel [case study]](https://chandoo.org/wp/wp-content/uploads/2014/04/mvp-logo.jpg)
This is the story of Vijay Agarwal, who received MVP Award from Microsoft on 1st of April.
Some of you know that I am a recipient Microsoft MVP award. It is an award Microsoft gives to software community leaders & contributors. Often people ask me, “Chandoo, how do I become an MVP?”. So today I want to tell you how you can become an MVP.
Around first week of April, I got an email from Vijay,
Hi Chandoo,
My self Vijay Agarwal from Delhi and I am a big fan of your site/articles. With blessing of God and inspiration from legends like you, I am pleased to inform you that yesterday evening I have been awarded Most Valuable Professional (MVP) award by Microsoft for my contributions in Excel.
I congratulated him immediately. It is always a pleasure to see people succeed and get recognition for their efforts. I also asked him if he can share his MVP journey to inspire all of us at Chandoo.org. Vijay being an awesome guy, wrote and send it promptly. So here we go.
Continue »CP006: How to be a better analyst? – Road map for getting better at Data Analysis & Improving your career prospects

Podcast: Play in new window | Download
Subscribe: Apple Podcasts | Spotify | RSS
In the 6th session of Chandoo.org podcast, we focus on making you a better analyst and propose a road map for getting better at data analysis & improving your career prospects.
In this podcast you will learn,
- Why become a better analyst?
- The road map for becoming a better analyst – BETTER framework
- B for Business Knowledge
- E for Examining user needs
- T for Thinking about analysis
- T for Tools of Trade ie Excel
- E for Expression
- R for Refining yourself
- Conclusions
Modeling tiles in a room using Excel Conditional Formatting

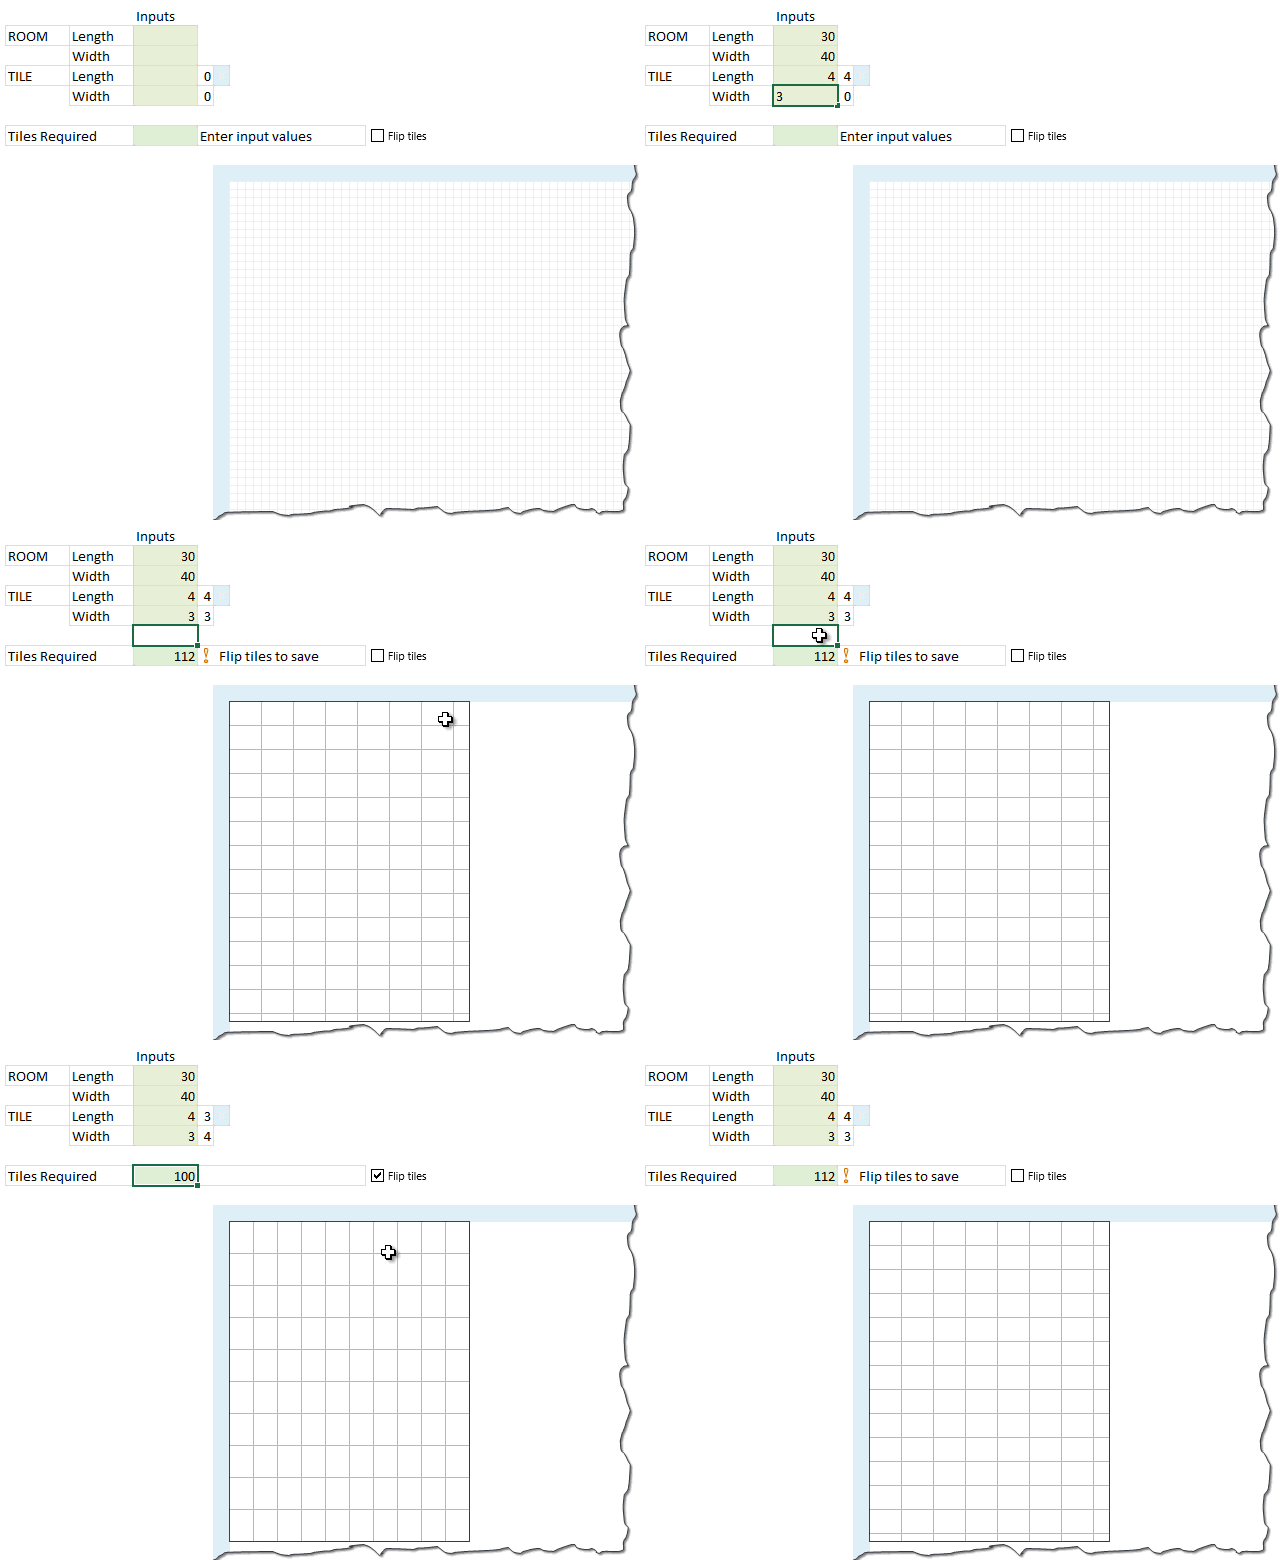
Last week we learned how to answer questions like, “How many tiles in a room?” using Excel. We learned about CONVERT function and fraction number format settings in Excel.
But why stop at calculation? We can even model a room full of tiles, thanks to Excel’s grid nature.
So today, we will learn how to create a room layout as shown above, using Excel.
Continue »There are Easter Eggs in this Excel file!!!

Hello Friends…,
It is Easter time again. Every year, we at Chandoo.org celebrate Easter by hunting for eggs (not in the wild, just in the Excel workbooks). This year too I have hidden 30 Excel tips in a workbook. You have to solve 3 puzzles to find them. So what are you waiting for. Go ahead and hunt for them eggs.
Click here to download the Easter eggs file.
I am sure you will enjoy them 🙂
Continue »CP005: Introduction to Form Controls – an interview with Debra Dalgleish

Podcast: Play in new window | Download
Subscribe: Apple Podcasts | Spotify | RSS
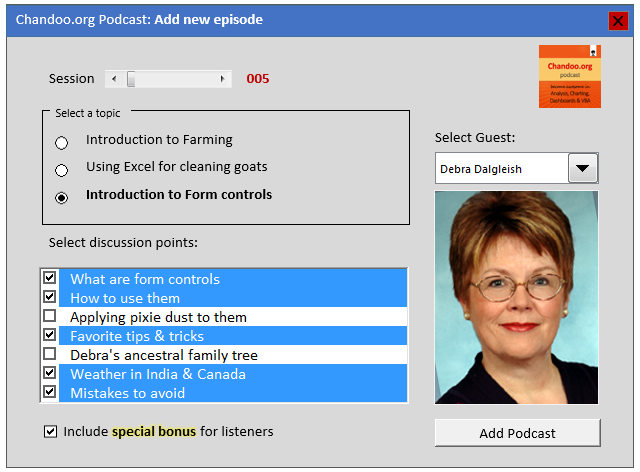
In the 5th session of Chandoo.org podcast, we are going to demystify form controls.
I am very happy and excited to interview my good friend, fellow Excel MVP, author, blogger and virtual mentor – Debra Dalgleish about this topic.
In this podcast, you will learn,
- What are form controls
- When you would use them?
- Example form control – Combo box
- How form controls differ from active-x controls
- How to enable form controls in your Excel?
- Various important form controls
- Special bonus & how to obtain it
Multiplying 24ft 9inches with 6ft 3inches using Excel

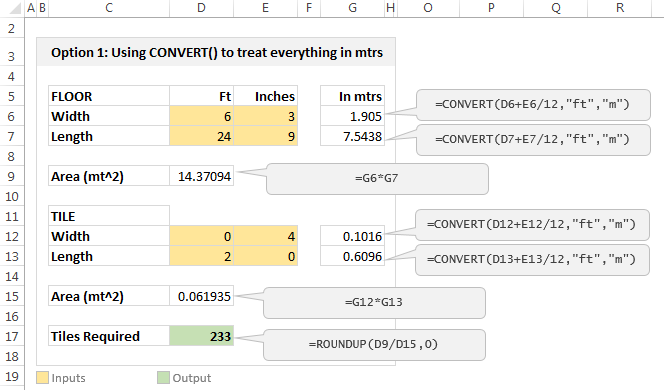
Imagine you are a carpenter and you are tasked with laying wooden floor at Gill Bates’ house. Now Gill B has a very big house and he wants to make sure you do a good job. So instead of asking you to lay the floor for entire house, he asks you to finish flooring in the guest bedroom first. Here are the dimensions of that guest bedroom.
- Width: 6ft 3inches
- Length: 24ft 9inches
- Size of individual wooden floor board: 2ft x 4inches
And here is the big question you are facing.
What?!? the guest bedroom width is only 6ft 3inches?
But over the years of chiseling and polishing you have learned to keep quiet and do your work.
So the real question you have is, How many wooden floor boards should you buy?
Of course, you want to find the answer using Excel. Why else would a carpenter read this blog?
Continue »Excel for iPad – Demo & Introduction [video]
![Excel for iPad – Demo & Introduction [video]](https://img.chandoo.org/ipad-excel/excel-for-ipad-demo-introduction.png)
Recently Microsoft has launched Excel app for iPad. Being an Excel addict, I could hardly wait to test it. And this is what we get.
Excel App for iPad – What is it?
Several years after iPad launch, Microsoft finally created apps for Word, Power Point, One Note & Excel. The Excel app is a miniature version of Excel on your iPad. It is capable of displaying almost all Excel workbooks with ease. You can even create your own workbooks using the app.
Continue »Visualize state to state migration data and you could win an iPad or Galaxy Tab [Datavis Contest 2014]
![Visualize state to state migration data and you could win an iPad or Galaxy Tab [Datavis Contest 2014]](https://chandoo.org/wp/wp-content/uploads/2014/04/chandoo-datavis-contest-2014-prizes.jpg)
Time for another dashboard contest. Sit straight, set aside your appointments and get number-crunching.
Analyze state to state migration data between 2012 & 2010 and present your results in a dashboard (or charts) and you could walk away with glory, fame & and an iPad.
If all of this sounds tempting, read on.
The contest
- Download dataset for the contest [mirror]
- Analyze the data and create a dashboard or set of charts (see rules below)
- Submit your workbook by 20th of April (Sunday), 2014.
- If readers at chandoo.org and our panel of judges love your work, you get one of the cool prizes.

Today we take a look at an exercise in how to develop a simple Calendar selection tool for your worksheets without using complex VBA Calendar Controls.
Continue »CP004: Can I Pie Chart in Public? Discussion about Pie charts, their merits and drawbacks, when to use & when to avoid them

Podcast: Play in new window | Download
Subscribe: Apple Podcasts | Spotify | RSS
In the 4th session of Chandoo.org podcast, lets talk about Pie charts.
Pie charts evoke strong opinions among analysts & managers. Some people love them and can’t have enough of them in reports. Others despise them and go to any lengths to avoid them. And that is why we are going to talk about them in this session.
You will learn,
- Special, secret transmission from guest stars
- What is a pie chart?
- Why they work? 2 reasons
- Why they don’t work ? 4 reasons
- Cousins & siblings of Pie charts
- Donut charts
- Gauge charts (speedometer)
- 3D pies
- Area charts
- Bubble charts
- 4 Situations when making a pie chart is ok
- Alternatives to Pie charts
- Mistakes you should avoid
- About the resources
- Conclusions


