All articles with 'videos' Tag
A better chart to visualize “Best places to live” – Top 100 cities comparison Excel chart
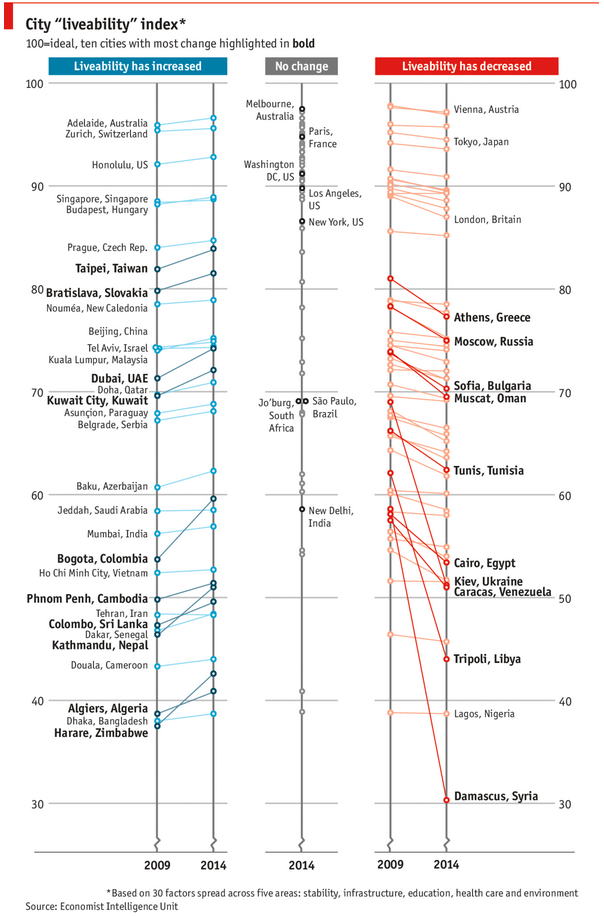
Recently, I saw this chart on Economist website.
It is trying to depict how various cities rank on livability index and how they compare to previous ranking (2014 vs 2009).

As you can see, this chart is not the best way to visualize “Best places to live”.
Few reasons why,
- The segregated views (blue, gray & red) make it hard to look for a specific city or region
- The zig-zag lines look good, but incredibly hard to understand % changes (or absolute changes)
- Labels are all over the place, thus making data interpretation hard.
- Some points have no labels (or ambiguous labels) leading to further confusion.
After examining the chart long & hard, I got thinking.
Its no fun criticizing someones work. Creating a better chart from this data, now thats awesome.
Continue »How fireworks animated chart is made [video tutorial]
On July 4th this year, I published an animated fireworks chart for you. Many of you liked it. Quite a few wanted to know how its made.
So here is a video explaining the construction of fireworks.
(You can see this video on our YouTube Channel too)
Continue »4th of July Fireworks – an Excel animation for you
To all our readers & friends from USA,
I wish you a happy, fun & safe 4th of July.
For the last 4th of July (2013), we (Jo, kids & I) were in USA. We went to Washington DC to meet up a few friends for that weekend. And we had one of the most memorable evenings of our lives when we went to national mall area in the evening to watch beautifully choreographed fireworks. Kids really loved the amazing display of fire-crackers and enthusiasm.
While we all are back in India this time, it doesn’t mean we cant celebrate 4th of July. So I made some fireworks. In Excel of course.
Here is a little Excel animation I made for all of us.
4th of July Fireworks – Excel animation
First watch this quick demo (<15 secs)
Continue »Matching transactions using pivot tables [video]
Last week, we learned how to use formulas to reconcile (match) transactions in Excel. Today, lets take a look at even faster and simpler way to do this:
Using Pivot Tables
Here is a short video explaining the technique and why it works. See it below
Continue »Excel for iPad – Demo & Introduction [video]
![Excel for iPad – Demo & Introduction [video]](https://img.chandoo.org/ipad-excel/excel-for-ipad-demo-introduction.png)
Recently Microsoft has launched Excel app for iPad. Being an Excel addict, I could hardly wait to test it. And this is what we get.
Excel App for iPad – What is it?
Several years after iPad launch, Microsoft finally created apps for Word, Power Point, One Note & Excel. The Excel app is a miniature version of Excel on your iPad. It is capable of displaying almost all Excel workbooks with ease. You can even create your own workbooks using the app.
Continue »Calculating Maximum Change [solutions & discussion]
![Calculating Maximum Change [solutions & discussion]](https://img.chandoo.org/hw/maximum-change-problem-solutions-and-video.jpg)
Last Friday, we had a fun little Excel challenge – Calculate Maximum Change. More than 170 people commented and shared their solutions to this problem.
And the best part?
The best part is the variety of solutions & thinking displayed by our community. So if you are one of those 170, puff your chest & pat yourself on the back. Go ahead, I will wait.
Today, lets take a look at some of these awesome formulas and understand how they work. Read on and watch the video you below to gain few awesomeness pounds.
Continue »Bar chart with lower & upper bounds [tutorial]
![Bar chart with lower & upper bounds [tutorial]](https://img.chandoo.org/c/bar-chart-with-lower-and-upper-bounds.png)
Bar & Column charts are very useful for comparison. Here is a little trick that can enhance them even more.
Lets say you are looking at sales of various products in a column chart. And you want to know how sales of a given product compare with a lower bound (last year sales) and an upper bound (competition benchmark). By adding these boundary markers, your chart instantly becomes even more meaningful.
Lets learn how to create a column chart with lower & upper bounds in this tutorial.
Continue »![Sporadic Totals in Excel [video]](https://img.chandoo.org/q/sporadic-totals-excel-example-data.png)
If this Excel problem is a Bollywood (Indian movie) plot, it would go like this:
Situation: Your boss gave you a worksheet. It has a lot of number chunks. And you need to calculate the sum of each chunk. Quickly!
Twist #1: The villain (your boss, who else) has abducted your spouse. For every extra hour you spend on the problem, your boss will make your spouse go thru one of the boring 97 slide strategy presentations. And his laptop is full of those strategy presentations.
Twist #2: The F1 key on your keyboard is missing.
Twist #3: The coffee machine in your floor is broken again.
Twist #4: And just when you are pressing CTRL+S, the movie steers in to an item song.
—-
Fortunately, no one abducted your spouse. And hopefully the coffee machine is working. But the Excel problem remains unsolved.
Continue »Making a slick on/off switch using Excel & little bit of VBA [case study]
![Making a slick on/off switch using Excel & little bit of VBA [case study]](https://img.chandoo.org/c/on-off-switch-interactive-chart-demo.gif)
I have a confession to make.
I am not sure how to describe this new thing I made in Excel / VBA. So first take a look at it.
Read on to learn how you can create something like this using Excel & a little bit of VBA.
Continue »Closing gaps in this Gender Equality Gap chart…

Today lets close some gaps.
Recently I saw this interesting chart on Economist Daily Charts page. This chart is based on World Economic Forum’s survey on how women compare to men in terms of various development parameters. First take a look at the chart prepared by Economist team.
So what are the gaps in this chart?
This chart fails to communicate because,
- All country charts look same, thus making it difficult to spot any deviations.
- We cannot quickly compare one country with another on any particular indicator.
- It does not provide a better context (for eg. how did these countries perform last year?)
But criticizing someone’s work is not awesome. Fixing it and making an even better chart, that has awesome written all over it. So that is what we are going to do. You can see the improved chart above. Click on it to learn how you can create it.
Continue »Last day for enrollments – Join our Power Pivot class & become awesome analyst
I have a quick announcement & a creative dashboard to share with you. First the announcement.
Only few hours left to join our Power Pivot course…
As you may know, I have opened enrollments for our 2nd batch of Power Pivot course few days ago. The aim of this course is to make you awesome in Excel, Advanced Excel, Dashboards, Power Pivot & Advanced Power Pivot.
We will be closing the doors of this program at midnight, today (11:59 PM, Pacific time, Friday, 16th of August).
If you want to join us, click here and enroll now.
Continue »Power Pivot online classes – now open for you

Hi friends, readers and supporters,
I am very glad to announce that our Power Pivot & Advanced Power Pivot classes are now open for you. If you are ready, Click here to join us.
Those of you new to this, read on.
What are these classes?
These days almost any job requires data analysis & presentation of results. While anyone can put a list of values in Excel & sum them up, not everyone can do advanced analysis, create charts, make them interactive, summarize data intelligently, present output in an intuitive dashboard or slice & dice data using Pivot tables & Power Pivot. Having these vital skills can make you invaluable to your organization & expose you to new opportunities. Not to mention the amount of time, money & effort you can save by efficiently using Excel.
That is why we have created 3 powerful courses – Excel School, Power Pivot & Advanced Power Pivot classes. Think of these as steps in a ladder.
Continue »Details about upcoming Power Pivot course (and a bonus tip on dashboards)

Hello friends..,
I have 2 things for you:
- Details about our upcoming Power Pivot courses
- A short video about designing better dashboards.
Ever seen a formula like =SUMIFS(Sheet1!B2:B3923, Sheet1!C2:C3923, A1, Sheet1!D2:D3923, A2) and wondered what it is really doing?!?
If so, you are not alone.
Formulas written with cell references tend to look complicated and clunky. What if we could write formulas in plain English?
That is what Structural References do. When using structural references in formulas, your focus will be on your data, not on which cell ranges the data takes up.
For example, you can write formulas like these:
1) SUM(mySales[no. of customers]) to find how many customers we had.
2) SUMIFS(mySales[no. of customers], mySales[product], “FastCar”) to find how many customers bought “FastCar”
As you may know, I am in USA and having a lot of fun exploring new areas, meeting people and conducting live classes. While all of this is enjoyable, I am also feeling guilty because I am unable to squeeze time to share Excel tips on the blog.
So to make it up to you, I recorded this short video (2 mins) with an Excel tip while bicycling in beautiful Euclid Creek Reservation in Cleveland on Friday. Watch it below.
Continue »


