All articles with 'Learn Excel' Tag
{ 44 Comments }
Use MAX to find latest date in a list [Quick tip]
Published on Jun 14, 2012 in Excel Howtos
Here is a quick tip that I learned while conducting training classes in Australia. If you have several dates in a range and you want to find out what the latest date is, just use MAX, like: =MAX(A1:A10) would give you the latest date. A Question…, Assuming you have some dates (not necessarily sorted) in […]
Continue »{ 17 Comments }
Thermo-meter chart with Marker for Last Year Value
Published on Jun 11, 2012 in Charts and Graphs, Excel Howtos

During a recent training program, one of the students asked,
Thermo-meter chart is very good to show how actual value compares with target (or budget). But how can we add another point for say Last Year value to the chart with out cluttering it.
Something like above.
Sounds interesting? Read on
Continue »
Today at Formula Forensics, we look at how to Count and Sum data using Criteria on Filtered data sets.
Continue »{ 20 Comments }
Sort Pivot Tables the way you want [Quick tip]
Published on May 31, 2012 in Excel Howtos, Pivot Tables & Charts
![Sort Pivot Tables the way you want [Quick tip]](https://img.chandoo.org/pivot/custom-sorting-pivot-tables.gif)
Ever looked at a Pivot table & wondered how you can sort it differently?
“If only I could show this report of monthly sales such that our best months are on top!”
Well, there is a way to do it without sacrificing 2 goats or pleasing the office Excel god. Just use custom sorting options in Pivot tables.
Continue »{ 27 Comments }
Do you work on Excel? How much salary you make? [Surveys]
Published on May 25, 2012 in Learn Excel
![Do you work on Excel? How much salary you make? [Surveys]](https://img.chandoo.org/polls/how-much-salary-survey.jpg)
Ever wondered how much your Excel skills are worth?
Here is 2 step procedure to find out.
1) Complete this survey. Tell me how much you make & what you do.
2) Wait for a week and we will tell you how much Excel professionals are earning all over the world 🙂
PS: You can be anonymous.
Continue »
How can we Add Up the Odd numbers between 1 and 100 ?
Continue »{ 15 Comments }
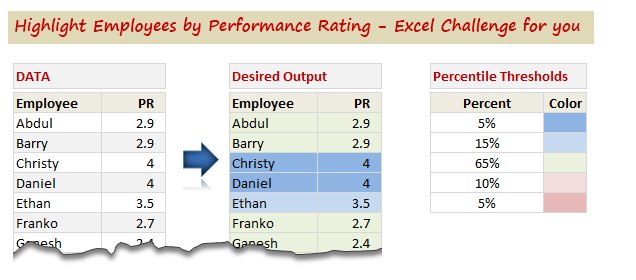
Highlight Employees by Performance Rating – Conditional Formatting Challenge
Published on May 18, 2012 in Excel Challenges, Learn Excel
So who is up for an Excel challenge?
Shelly, who is an HR Manager sent this distress call last week,
“I have a group of employees- lets say 100 employees. Each employee has a performance rating attached to them. I want to divide the group by 5%, 15%, 65%, 10%, 5% based on their performance rating.”
And that is our challenge today. Read on & help Shelly.
Continue »
No, Not that Slash !
How do I find the 4th Slash in a text string?
Today at Formula Forensics we take a look at 4 different methods.
{ 1 Comment }
Please Enroll in our Excel & Dashboards Masterclass – Melbourne
Published on May 16, 2012 in Excel Workshops, Learn Excel
Hello folks,
I have a quick announcement. As you may know, I am doing a set of Excel & Dashboards Masterclasses in Sydney, Melbourne & Brisbane. We had a fantastic session in Sydney (with 18 delegates). We are sold out in Melbourne & have 2 spots left in Brisbane. But we kept getting requests for more in Melbourne. So we have added an additional session in Melbourne. This is right after Queen’s birthday – on 12th & 13th of June. Please use below links to enroll for the masterclass if you are interested.
Reviews from our Sydney masterclass delegates
We asked the delegates of our Sydney masterclass to tell us how they liked it. Here is a short video with their reviews (4 min):
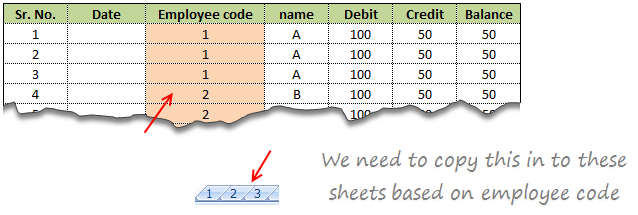
Suresh sent an email with interesting problem.
There is one data entry sheet where all the data needs will be entered, however once done we want the data to be stored separately in multiple sheets designated by the Employee code.
In this article we will learn how to use VBA to help in resolving the problem Suresh was facing at work.
Continue »![Interactive Sales Chart using MS Excel [video]](https://img.chandoo.org/vp/interactive-sales-chart-quick-demo.gif)
Finally, I got some time to sit down and do what I love most – write a blog post to make you awesome in Excel. After a whirlwind trip to Sydney, I am back in India to spend few days with my kids & wife before rushing to Australia to run 2nd leg of my training programs (in Perth, Melbourne & Brisbane). I did 2 sessions in Sydney – one for KPMG and other for public and both went very well. We got lots of positive feedback and people really loved it. I am saving the details for another post, but today lets talk about Interactive Sales Chart using Excel.
Take a look at the Interactive Sales Chart
First, take a look at interactive sales chart. Today, you will learn how to build this using Excel.
Continue »
Pivot tables are a great way of summarising and consolidating data to produce summary reports.
One of the main limitations of Pivot tables is that they don’t natively return Text values.
This post looks at a method to work around this without the use of VBA.
Continue »
Bhavik’s has presented us with a neat formula to determine how many working days are in a month.
This functionality has a wide range of uses in accounting, payroll, staff scheduling, accommodation planning & reporting and general scheduling activities.
Today in Formula Forensics we pull Bhavik’s Formula apart and see what is going on inside and the offer some extensions to increase the functionality of his formula.
Continue »
Hello folks,
My flight to Sydney has been lengthy but fun. I have reached here on Sunday morning (8AM) and spent most of the day with Danielle’s family. (Danielle is the founder of Plum Solutions. She is the one who invited me to Australia and planned this whole experience for me).
On Monday (30th April), I went exploring the city on foot. I had coffee in the beautiful Queen Victoria Building, attended 1PM church service at the magnificent St. Mary’s cathedral, walked thru Hyde park, went to Sydney central station, took at sneak peek at the new Apple store in down town, got back to my hotel, walked to Opera house to meet up with our readers.
Reader meetup at Sydney
We had 6 people turn up for the meetup. It was fun talking about Excel & our journey with these wonderful folks. Here is a pic (you can see the harbor bridge in background & 8 awesome Excel users in foreground, Click on it to enlarge).
{ 7 Comments }
Adding Macros & Final Touches to Customer Service Dashboard [Part 4 of 4]
Published on Apr 26, 2012 in Charts and Graphs, VBA Macros
![Adding Macros & Final Touches to Customer Service Dashboard [Part 4 of 4]](https://img.chandoo.org/dashboards/macros-vba-in-customer-service-dashboard.png)
Welcome back. In final part of Making a Customer Service Dashboard using Excel let us learn how to add macros & VBA code that makes our dashboard interactive.
As you can see, there are 2 important macros in this dashboard.
Continue »
