
Excel Links – Live from Sydney Edition
excel links - 4 comments
Hello folks,
My flight to Sydney has been lengthy but fun. I have reached here on Sunday morning (8AM) and spent most of the day with Danielle’s family. (Danielle is the founder of Plum Solutions. She is the one who invited me to Australia and planned this whole experience for me).
On Monday (30th April), I went exploring the city on foot. I had coffee in the beautiful Queen Victoria Building, attended 1PM church service at the magnificent St. Mary’s cathedral, walked thru Hyde park, went to Sydney central station, took at sneak peek at the new Apple store in down town, got back to my hotel, walked to Opera house to meet up with our readers.
Reader meetup at Sydney
We had 6 people turn up for the meetup. It was fun talking about Excel & our journey with these wonderful folks. Here is a pic (you can see the harbor bridge in background & 8 awesome Excel users in foreground, Click on it to enlarge).

Later in the evening, I took a ferry from circular quay to darling harbor, watching the night lights of downtown Sydney. What a memorable day.
Now, I am getting ready for my first day of Excel training (I am doing a 2 day session with KPMG today & tomorrow), I am feeling excited.
But don’t worry that only KPMG folks are getting their dose of Excel today. I have something for you too. Here is a collection some really interesting Excel links. Click thru to learn more.
Update Data Source of all Pivots
As a data analyst, I am sure you have at least one file that has multiple pivot tables, sourced from different data sets. Now, what do you do when the source data changes? If you are not using Excel Tables, it is a hassle to update all the Pivot data sources to reflect new data. Well, Debra comes to rescue again with a macro that updates all data sources in one shot.
Sending Emails using Excel & Outlook – JP’s take
JP, well known for his Excel & Outlook blog, took a look at our recent Send mails using Excel & Outlook example and rewrote the macro in his style. Check out his code & commentary to understand how you can improve the sendmail macro.
Use Home > Insert to add calculated fields to Pivots
Mike, while making a tour between the snack plate & dip bowl, stumbled on to a very useful feature in the Insert menu on Home ribbon. When you are dealing with Pivots, you can add a calculated field by just using Home > insert. This is a lot faster than doing it from the Pivot table ribbons. I am not sure what dip Mike uses, but I am going to try it too 😉
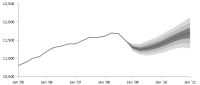 Excel fan charts to show uncertainty in projections
Heard about Excel fan charts? Me neither. But for every Excel charting problem that is as hard as a macadamia nut, there is a Jon Peltier tutorial to show it to you. So in this tutorial, Jon tells us how to create fan charts in Excel to show the uncertainty in projections. Very interesting. And unlike macadamia nuts, this is not going to leave you with broken teeth or bleeding jaws.
Carbon Footprint of Countries [Chart inspiration]
And finally, some chart inspiration. Here is an interactive chart showing the carbon competitiveness index of various countries. Check it out and play with it. And now, go back to Excel and see how you can implement some of those ideas. That will make your Tuesday interesting. 🙂
Got any Excel links that you want to share with us?
I am always looking for new websites and resources to learn Excel & Visualization. So if you came across something that is awesome and want to share it with us, send it to me at chandoo.d @ gmail.com or drop a comment here. Thanks in advance.

Hello Awesome...
My name is Chandoo. Thanks for dropping by. My mission is to make you awesome in Excel & your work. I live in Wellington, New Zealand. When I am not F9ing my formulas, I cycle, cook or play lego with my kids. Know more about me.
I hope you enjoyed this article. Visit Excel for Beginner or Advanced Excel pages to learn more or join my online video class to master Excel.
Thank you and see you around.
Related articles:
|
Leave a Reply
| « Thank you, I am flying to Australia today! | Formula Forensic 020. Bhavik’s Monthly Workingdays Formula » |
 At Chandoo.org, I have one goal, "to make you awesome in Excel & Power BI". I started this website in 2007 and today it has 1,000+ articles and tutorials on data analysis, visualization, reporting and automation using Excel and Power BI.

4 Responses to “Excel Links – Live from Sydney Edition”
Always working hard Chandoo! Keep up the good work. Also did you know your name can be read like this? "can-do"! What a perfect pun for excel!
Have been recently visiting your page for tips and really impressed with some of the tips. And its more fun to read the comments with all possible alternates.
Thank you.
I dont know how to thank you for your Awesome updates...
omg i work for KPMG in US and i've been your subscriber for quite some time !!! :] keep up the good work!