All articles with 'excel tables' Tag
{ 6 Comments }
Thank you, Houston meetup & Bonus tip
Published on Sep 12, 2014 in Excel Howtos, personal
My mom will be very unhappy with this post. She always told me to focus on one thing at a time. But in this post we are talking about 3 things, not one. Sorry mom.
1. Thank you
I want to thank you for visiting chandoo.org & supporting us.
As I am about to leave to USA for attending Excelapalooza conference, I couldn’t help but be amazed at how much you have given me & my family. Almost 4.5 years ago, when I left my plush corporate job to work full time on Chandoo.org, I had no clue how the future will unfold. Today my heart is full of happiness, my family is secure, my site has grown by heaps and our community (especially you) is awesome.
Without your enthusiasm to learn and keen desire to become awesome, I would not have a job (of running this website). You inspire me to learn new things everyday so that I can share them with you.
Thank you for all the visits, clicks, comments, emails, tweets, likes, signups, purchases & love.
Thank you.
Continue »{ 9 Comments }
Top 10 things we struggle to do in Excel & awesome remedies for them
Published on Jun 18, 2014 in Charts and Graphs, Learn Excel, Pivot Tables & Charts, Power Pivot, VBA Macros
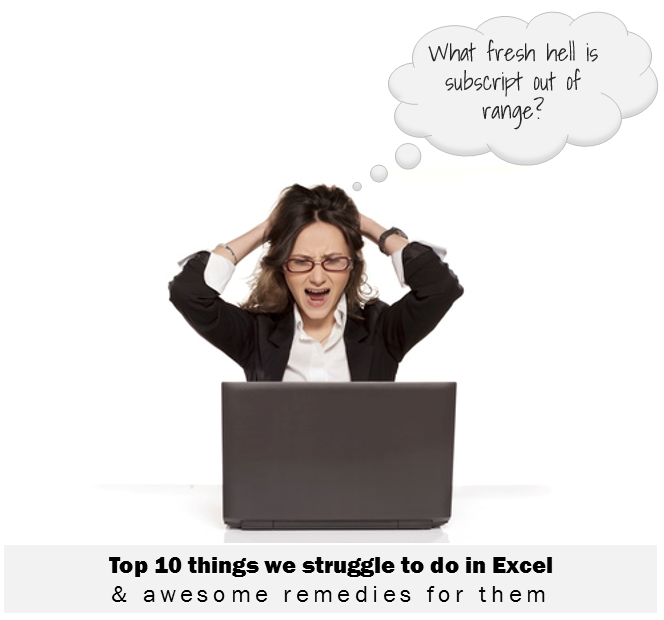
Recently we asked you, what do you struggle doing in Excel? 170 people responded to this survey and shared their struggles. In this post, lets examine the top 10 struggles according to you and awesome remedies for them.
Continue »{ 45 Comments }
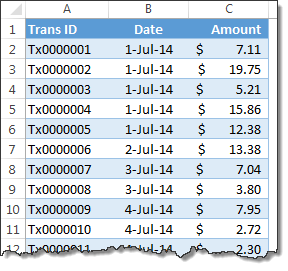
Matching transactions using formulas [Accounting]
Published on Jun 6, 2014 in Excel Howtos, Learn Excel
![Matching transactions using formulas [Accounting]](https://img.chandoo.org/f/example-of-matching-transactions.png)
Imagine you are the head of Accounts Receivable department at a large company. Drab, I know, But humor me and imagine.
Now, every month you get a transaction report.
And you want to know which numbers are matching up.
i.e, if your company gave Vendor-0002 $872.34 on 1st of April, 2014 and your received below payments from them subsequently,
- $427.77 on 1st April
- $152.88 on 2nd April
- $291.69 on 2nd April
Then you consider the account matched since the total received is same as total payable.(427.77 + 152.88 + 291.69 = 872.34).
Continue »{ 19 Comments }
Free Invoice Template using Excel – Download
Published on Mar 19, 2014 in excel apps, Learn Excel
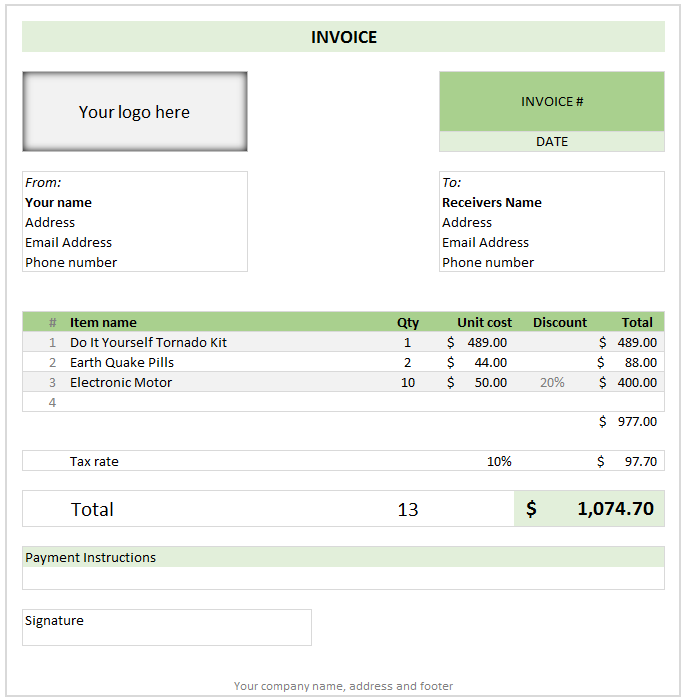
Anyone running a small business knows the oozing bits of joy when you hear a customer saying, “Can you send me an invoice?”
While creating an invoice is an easy task, if you want something that is professional looking, easy to manage and works well, then you are stuck.
That is where Excel really shines. By using an invoice template, you can quickly create and send invoices.
Today I want to share one such template with you all. Why? Because we are awesome like that.
Continue »{ 59 Comments }
Robust Dynamic (Cascading) Dropdowns Without VBA
Published on Feb 25, 2014 in Learn Excel, Posts by Jeff
Recently I posted about how you could construct dynamic (cascading) dropdowns that could easily handle multiple levels, like this: …and we saw that users could subsequently change upstream dropdowns in a way that would make downstream choices invalid, like this: In my previous post I used some VBA to clear out any ‘downstream’ choices if […]
Continue »Dynamic dropdowns are a handy way to get your users to make choices based on what they’ve previously chosen, while steering them away from making invalid choices. Today we’re going to look at one that easily handles multiple levels, and we’ll take a look at what could go wrong. Let’s see one in action, shall […]
Continue »What do you use Excel Tables for?
I will go first, I use them for,
1) Maintaining all my raw data, so that I can use structural references
2) Maintaining various trackers, for example I am tracking all our expenses in USA in a table.
3) For quick formatting of data (zebra lining, filters, sorting etc.)
What about you? What kinds of data are you holding in tables and how are you using them. Please share using comments
Continue »Ever seen a formula like =SUMIFS(Sheet1!B2:B3923, Sheet1!C2:C3923, A1, Sheet1!D2:D3923, A2) and wondered what it is really doing?!?
If so, you are not alone.
Formulas written with cell references tend to look complicated and clunky. What if we could write formulas in plain English?
That is what Structural References do. When using structural references in formulas, your focus will be on your data, not on which cell ranges the data takes up.
For example, you can write formulas like these:
1) SUM(mySales[no. of customers]) to find how many customers we had.
2) SUMIFS(mySales[no. of customers], mySales[product], “FastCar”) to find how many customers bought “FastCar”

Last week, we had a lovely poll on what are your favorite features of Excel? More than 120 people responded to it with various answers. So I did what any data analyst worth his salt would do,
I analyzed the data and here are the top 10 features in Excel according to you.
Read on to learn more.
Continue »{ 132 Comments }
Designing a dashboard to track Employee vacations [case study]
Published on Jan 24, 2013 in Charts and Graphs, Learn Excel
![Designing a dashboard to track Employee vacations [case study]](https://chandoo.org/wp/wp-content/uploads/2013/01/employee-vacation-dashboard-full-view.png)
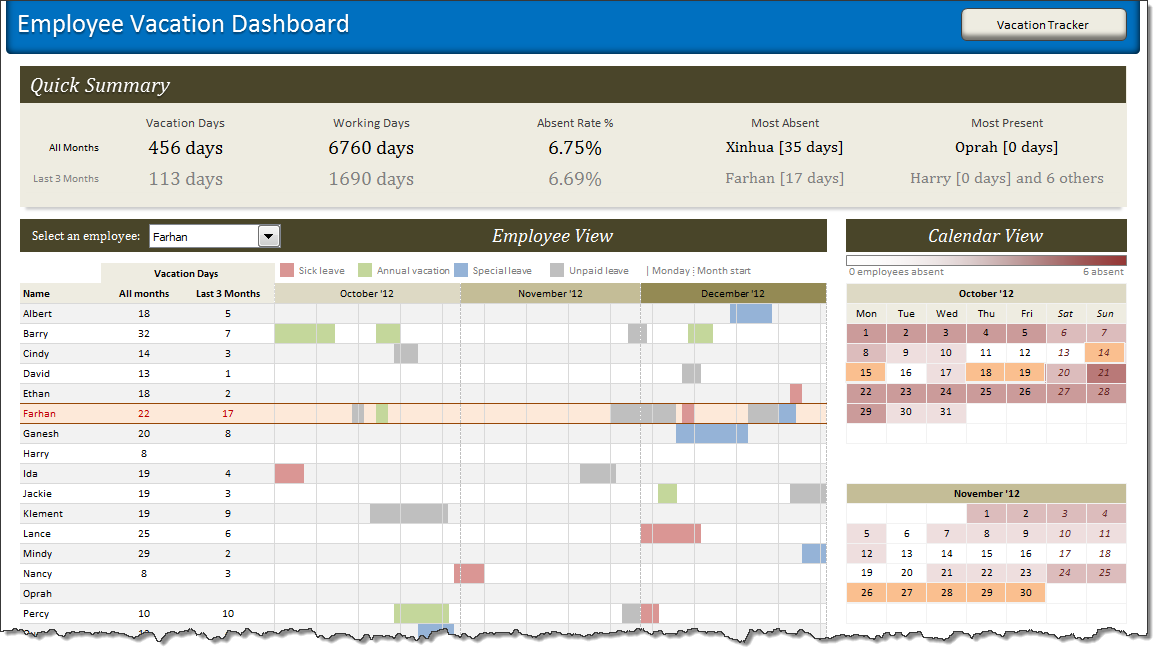
HR managers & department heads always ask, “So what is the vacation pattern of our employees? What is our average absent rate?”
Today lets tackle that question and learn how to create a dashboard to monitor employee vacations.
What do HR Managers need? (end user needs)
There are 2 aspects tracking vacations.
1. Data entry for vacations taken by employees
2. Status dashboard to summarize vacation data
{ 12 Comments }
Highlight best week & month in a trend chart [tutorials]
Published on Dec 12, 2012 in Charts and Graphs
![Highlight best week & month in a trend chart [tutorials]](https://img.chandoo.org/c/highlight-best-week-month-in-trend-charts-excel-howtos.png)
When analyzing business data like sales, shop visits or productivity, one of the questions managers always ask is,
What is the best month / week for this data?
To answer this question, we need to make a chart that looks like above. Today, lets learn how to highlight portions of such charts that correspond to best week or best month.
Continue »{ 14 Comments }
Customize Zebra lines Quickly using Table Styles [tip]
Published on Sep 19, 2012 in Excel Howtos
![Customize Zebra lines Quickly using Table Styles [tip]](https://img.chandoo.org/q/custom-zebra-lines-excel-tip.png)
Zebra lines, the dull highlighting applied to alternative rows is a very good way to make your tables readable & pretty.
We can use either conditional formatting or table formats to quickly add zebra lines to our data.
But what if you want a little more?
What if you want to highlight, lets say 3 rows in one color and 3 in another and repeat this …
Continue »
Today, lets learn OFFSET formula.
OFFSET formula gives us reference to a range, from a given starting point with given height and width in cells.
OFFSET formula syntax
OFFSET formula looks like this:
=OFFSET(starting point, rows to move, columns to move, height, width)
Starting point: This is a cell or range from which you want to offset
Rows & columns to move: How many rows & columns you want to move the starting point. Both of these can be positive, negative or zero. More on this below.
Height & width: This is the size of range you want to return. For ex. 4,3 would give you a range with 4 cells tall & 3 cells wide.
Read on…,
Continue »![Interactive Sales Chart using MS Excel [video]](https://img.chandoo.org/vp/interactive-sales-chart-quick-demo.gif)
Finally, I got some time to sit down and do what I love most – write a blog post to make you awesome in Excel. After a whirlwind trip to Sydney, I am back in India to spend few days with my kids & wife before rushing to Australia to run 2nd leg of my training programs (in Perth, Melbourne & Brisbane). I did 2 sessions in Sydney – one for KPMG and other for public and both went very well. We got lots of positive feedback and people really loved it. I am saving the details for another post, but today lets talk about Interactive Sales Chart using Excel.
Take a look at the Interactive Sales Chart
First, take a look at interactive sales chart. Today, you will learn how to build this using Excel.
Continue »{ 122 Comments }
10 Excel Keyboard Shortcuts I can’t live without!
Published on Aug 8, 2011 in Learn Excel

Everyone and their colleague knows the importance of Excel keyboard shortcuts. While it may be a good idea to know a 97 different shortcuts for everything in Excel, the fact is, you don’t use them all the time. So, it all boils down to memorizing the few shortcuts that you use all the time.
In this post, I am sharing 10 such shortcuts that I can’t live without, especially, when I am analyzing data, making charts and formatting my workbooks.
Continue »
