All articles with 'Microsoft Excel Conditional Formatting' Tag
![How to Visualize Survey Results using Incell Panel Charts [case study]](https://chandoo.org/img/cb/survey-results-panel-chart-example.png)
A panel chart (often called as trellis display or small-multiples) shows data for multiple variables in an easy to digest format. It lets users compare in any way and draw conclusions with ease.
Today, I want to discuss how the principles of panel chart can be applied to visualize a complex set of survey results. For this we will use the recent survey conducted by Gartner on how various customers use BI (Business Intelligence) tools.
Continue »
In October 2008, I have started an ambitious series of posts on this blog called – Spreadcheats. These are little tricks, nuggets, tutorials on using Excel that would make anyone a spreadsheet guru.
The spreadcheats series has been wildly successful. I am compiling all this useful information and articles in to one big post so that anyone can follow the links and become good in Excel. Read on,
[Note: This is not for beginners. If you know what a formula is, you would enjoy this 31 articles]
Continue »{ 30 Comments }
Annual Goals Tracker Sheet [awesome ways to use excel]
Published on Mar 1, 2010 in Charts and Graphs, excel apps
Marko, who is a long time PHD reader and an excel ninja sent this via email, I work at an insurance company in Slovenia. At the beginning of each year we have a conversation with our superiors to review our work in the past year and to set new goals (main activities) that we’re gonna […]
Continue »{ 14 Comments }
Group Project Activities to Make Readable Gantt Charts
Published on Feb 11, 2010 in Charts and Graphs, Learn Excel
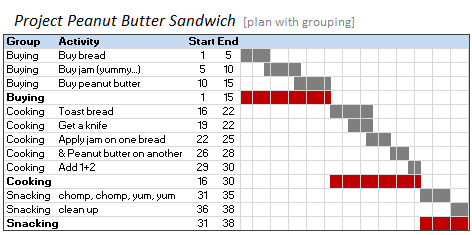
In Excel Gantt Charts part of our project management series, we have discussed about how using Conditional Formatting and Formulas we can make a gantt chart like this: But when you have large project plans, gantt charts like above can get pretty intense and hard to read. So a better approach is to group various […]
Continue »{ 31 Comments }
Flu Trends Chart in Excel [Yes, we can edition]
Published on Jan 22, 2010 in Charts and Graphs, Featured
![Flu Trends Chart in Excel [Yes, we can edition]](https://chandoo.org/img/p/flu-trends-chart-final-th.png)
Last week I have reviewed Google’s flu trends chart and told you that is it is very well made. Out of curiosity I made a similar chart in Excel. In this post, I am going to share the experience and results with you. Interested? Read on…
Continue »{ 34 Comments }
Use “Playbill” font to make your incell charts realistic [quick-tips]
Published on Jan 21, 2010 in Charts and Graphs
![Use “Playbill” font to make your incell charts realistic [quick-tips]](https://img.chandoo.org/c/use-playbill-font-incell-charts.png)
Most of you already know that using the REPT formula along with pipe (“|”) symbol, we can make simple in-cell charts in excel. For eg. =REPT(“|”,10) looks like a bar chart of width 10. Despite the simplicity, most people don’t use in-cell charts because these charts don’t look anything like their counterparts. But you can […]
Continue »{ 13 Comments }
Highlighting Repeat Customers using Conditional Formatting [Part 2 of 2]
Published on Jan 6, 2010 in excel apps, Learn Excel
![Highlighting Repeat Customers using Conditional Formatting [Part 2 of 2]](https://chandoo.org/img/n/repeat-customers-excel-conditional-formatting.png)
This is second part of 2 part series on conditionally formatting dates in excel.
Highlighting Repeat Customers using Conditional FormattingIn yesterday’s post we have learned how to conditionally format dates using excel. In this article, you will learn how to use these conditional formatting tricks to highlight repeat customers in a list of sales records.
Continue »{ 187 Comments }
Conditionally Formatting Dates in Excel [Part 1 of 2]
Published on Jan 5, 2010 in Excel Howtos, Learn Excel
![Conditionally Formatting Dates in Excel [Part 1 of 2]](https://chandoo.org/img/n/conditional-formatting-button.png)
This is first part of 2 part series on conditionally formatting dates in excel.
Conditional formatting is a very useful feature in Excel. You can use Conditional formatting to tell excel how to format cells that meet certain conditions. For eg. You can use conditional formatting to show all negative values in a range in red color. Today we will learn how to use conditional formatting to format dates.
Continue »{ 115 Comments }
Sales Dashboards – Visualizing Sales Data – 32 Dashboard Examples & Implementations
Published on Jan 4, 2010 in Charts and Graphs, Featured

Sales reports and dashboards are very common in any company. There are several ways in which you can visualize sales data to understand the trends and sales performance. So in November, I have asked you to visualize sales data using sample data. The visualization challenge #2, sponsored by Zoho Reports generated a huge buzz around the community and fetched 32 incredible entries. The response was so overwhelming that it took me almost 24 hours to write this post. Thanks everyone for participating and making this a huge learning experience for everyone. Personally I have learned several useful dashboard and charting tricks. I will be sharing some of these lessons with all of you in the coming weeks.
Continue »![2010 Calendar – Excel Template [Downloads]](https://chandoo.org/img/n/2010-calendar-thumb.png)
Here is a 2010 new year gift to all our readers – a free 2010 calendar excel file (a little secret: just change the year in “outline” sheet from 2010 to 2011, to get the next years calendar. It works all the way up to year 9999). You can even get a Printable PDF Calendar. There are 14 different sheets in the calendar file. First one is an outline calendar for the entire year. The next 12 are monthly calendars. And the last sheet shows a mini-calendar for the year 2010.
Read the rest of this post to know more and download the calendar.
Continue »{ 15 Comments }
Christmas Gift List – Set your budget and track gifts using Excel
Published on Dec 7, 2009 in excel apps, Learn Excel
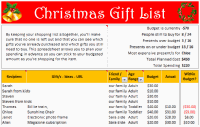
Steven, one of our readers from England sent me a Christmas gift tracker worksheet. I found it pretty cool, so made some minor changes to it and sharing it with you all so that you can have great time shopping for the holidays.
The workbook is full of lessons on conditional formatting, cell formatting, using formulas. Go ahead and download it today.
Continue »{ 15 Comments }
Baby Feeding Chart using Excel
Published on Oct 12, 2009 in Charts and Graphs, Learn Excel

While feeding the babies last night, I had this idea. Why not make an excel sheet where you can keep track of the baby’s feeding and sleeping activities on day to day basis. It would probably help you understand your baby’s needs better and may be give you some insights.
Continue »![Project Management Dashboard / Project Status Report using Excel [Part 6 of 6]](https://chandoo.org/img/pm/project-status-dashboard-th.png)
Project management dashboards, project status reports help stakeholders, project sponsors and team-members can understand project status very quickly. In the last installment of project management using excel, learn how to make project management dashboard using excel in this tutorial. Also download the excel project status dashboard template.
Continue »{ 15 Comments }
How to get tick marks in Excel? [custom cell formatting]
Published on Sep 15, 2009 in Excel Howtos, Learn Excel
![How to get tick marks in Excel? [custom cell formatting]](https://chandoo.org/img/i/showing-tick-marks-using-excel.png)
Here is tricky scenario, faced by Basil, our forum member, “I want to have Excel display a wing ding check mark when a user types “y” in a cell. I have been trying to do a substitute formula but putting the symbol in an unused portion of the spreadsheet and calling it to the selected cell but I can’t get it to work. Any thoughts?”
We can use either cell formatting or conditional formatting to achieve this.
Continue »{ 33 Comments }
Excel Time Sheets and Resource Management [Project Management using Excel – Part 4 of 6]
![Excel Time Sheets and Resource Management [Project Management using Excel – Part 4 of 6]](https://chandoo.org/img/pm/timesheets-excel-templates.gif)
Timesheets are like TPS reports of any project. Team members think of them as an annoying activity. For managers, timesheets are a vital component to understand how team is working and where the effort is going. By using Microsoft Excel capabilities you can create a truly remarkable timesheet tracking tool.
In this installment of project management using excel series, we will learn 3 things about timesheets and resource management using Excel
1. How to setup a simple timesheet template in excel?
2. How to make a more robust timesheet tracker tool in Excel?
3. How to use the timesheet data to make a resource loading chart?

