

This is first part of 2 part series on conditionally formatting dates in excel.
Conditional formatting is a very useful feature in Excel. You can use Conditional formatting to tell excel how to format cells that meet certain conditions. For eg. You can use conditional formatting to show all negative values in a range in red color. [Learn conditional formatting basics].
Today we will learn how to use conditional formatting to format dates.
Click on the below links to jump to relevant section.
Excel 2007+ – Conditional Formatting Dates
Excel 2003 – Conditional Formatting Dates
Excel 2007+ – Conditional Formatting Dates
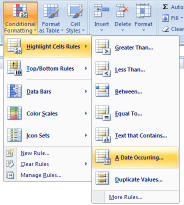
In Excel 2007, MS introduced several useful shortcuts to conditionally format dates. When you select some cells and click on Conditional Formatting button on ribbon and select “Highlight cells Rules” > “A date occurring”, Excel presents you quick shortcuts to frequent date criteria. This list includes options to format,
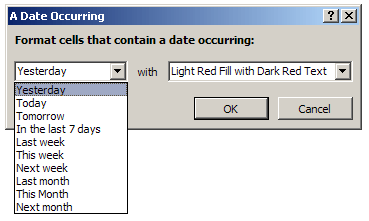
- A Date if it is yesterday
- Today
- Tomorrow,
- In the last 7 days
- Last week
- This Week
- Next Week
- Last Month
- This Month
- Next Month
Using this feature, you can quickly format the dates in your data meeting certain criteria.
This is very useful in situations where you want to highlight for eg. sales in last week. As the dates change, the highlighted values change dynamically.
Apart from these predefined date conditions, you can define your own conditions using formulas.
Excel 2003 – Conditional Formatting Dates
Unlike Excel 2007, there are no shortcuts for conditional date formatting in Excel 2003. You have to rely on Conditional Formatting Formulas to do this.
What is a conditional formatting formula?
In excel you can use formulas to determine which cells get the special formatting thru conditional formatting. For eg. a formula like =A1>50 applied over the range A1:A10 will highlight the cells with value more than 50.
So, to check if the date in cell A1 is yesterday, you can write a simple formula like,
=TODAY()-A1=1. [help on TODAY formula]

Here are some formulas to get you started,
- To check if a date is in the last 7 days:
=TODAY()-A1<7 - To check if a date is in the current week:
=AND(WEEKNUM(A1)=WEEKNUM(TODAY()), YEAR(A1)=YEAR(TODAY())) - To check if a date is in the current month:
=AND(MONTH(A1)=MONTH(TODAY()), YEAR(A1)=YEAR(TODAY())) - To check if a date is in the last 30 days:
=TODAY()-A1<30
[Help on AND formula, MONTH formula, YEAR formula, IF formula]
Using above formula based conditional formatting you can easily determine if a date meets a given criteria and highlight it.
A Practical Application – Highlighting Repeat Customers
Let us say you run a small retail store. And you want to give special discounts to all the repeat customers. In your mind a repeat customer is someone who bought twice from you in last 30 days. (If the person bought twice but the gap between 2 purchases is more than 30 days they are not repeat customers).
In tomorrow’s post I will show you how to highlight repeat customers using excel conditional formatting. Stay tuned.
Learn more about Excel Conditional Formatting
- Excel conditional formatting basics
- Using formulas in excel conditional formatting – 5 kickass examples
- Highlight Top 10 items in a list – using conditional formatting
- More tutorials on Conditional Formatting, Excel Dates, Excel Date Formulas
Join our email news letter:
If you like this article, please join our mailing list. You will get an excel tip every weekday. Also, you will get a free copy of my 95 excel tips e-book. Click here to join.


187 Responses
I think you have a typo in your 2nd date formula. You posted this…
=AND(WEEKNUM(A1)=WEEKNUM(A1), YEAR(A1)=YEAR(TODAY()))
I think you meant this…
=AND(WEEKNUM(A1)=WEEKNUM(TODAY()), YEAR(A1)=YEAR(TODAY()))
@Rick.. My mistake. Thanks for pointing it out. I have corrected it now.
Thanks for blogging about Excel and some of the conditional formatting features. I’m sure the folks over at Excel would appreciate you sharing your expertise with the community!
Check out the Office page on Facebook at http://www.facebook.com/Office.
Cheers,
Kim
MSFT Office Outreach Team
Dear Sir,
how to prepare the result chart on excel ?Please advice me?
Thanks
@Taj… what do you mean by result chart?
hi there
how can i have a condition for a date is that is before today (meaning anytime the doc is open) if the date is before that then the cell format changes? i had a formula for this from 2003 but its not working when i pasted in 2007
thanks!
@Tracy.. welcome to PHD and thanks for your comments.
Assuming the date is in cell A1, go to CF and select new rule > based on formula
now type =a1<today()
and set formatting
This should work.
Chandoo, how would do this for a column of dates? You don’t have to put a rule in for every cell that contains a date do you? Thanks!
Okay I am using Excel 2007. I have created a monthly calendar using an array formula. I have used cf to highlight cell for if date is today and cf this month is in a three month time period. I want a cf to highlight dates that are holidays in which the college is closed. Can you help me?
@Jenine… lets say your holiday list (actual dates) is in the named range lstHolidays and assuming the calendar is in range A1:G5
Now, select the calendar, go to CF > new rule
select formula option.
Now write, =countif(lstHolidays,A1)>0
and then set formatting you want.
This should work provided the range A1:G5 contains actual dates. Otherwise, you can easily convert the value in A1:G5 to dates using DATE() formula and then pass them to COUNTIF to check for holiday criteria.
I want to change date format (01/10/2009)(dd/mm/yyyy) to 01-Oct-09 (dd/mmm/yy) but cell not convert to this format. if change format show 10-Jan-09. this cell convert from PDF and i dont change its formatting so please tell me whats we do.
2nd option is that break this cell to 3 cell and joint with =date(dd/mmm/yy) format.
tell me.
and Thanks
Is there a way to add values to the drop down menu for “dates occurring”…they have a bunch for the past and the close distant future…but don’t have anything beyond “next month” for the future….which is silly, ridiculous, but typical for Microsoft…most companies that use this feature for planning definitely plan things out farther then next month…
if not, can you please advise on formulas for “next 3 months,” “this year”…and “next year”
Thanks
@Ethan… Welcome to chandoo.org and thanks for commenting.
You can use formulas to check for these conditions.
next 3 months = a1=median(today(),a1,today()+90)
or =a1=median(date(1,month(a1),year(a1)),a1,date(1,month(a1)+3,year(a1)))
for next year,
=year(a1)=year(today())+1
for this year,
=year(a1)=year(today())
All the best.
thank you very much….i wonder if there is a way to add them to the drop down,….if i find out how i’ll let you know
There is a slight problem with your equations for checking if a date in in the past 7 or 30 days…it returns a true value if the date is in the future…since today minus tomorrow is negetive, and therefore is still less than 7 or 30…if you change the formula for 30 days from =TODAY()-A1<30 to =(TODAY()-C190) you get the correct values even for a future date
for some reason the new formula didn’t paste right in my last post…should be
=(TODAY()-C10)
A conditionally formatted date cell that I believe is not possible.
I have a column of dates, displayed as day of the week, then the date, then year. I wish to have data formatted based on the day of the week. For example, if the day is Monday to Thursday, it would be one color, then another color if it is Friday through Sunday.
Is this possible?
@Ethan: good point.. thanks for correcting me.
@John: Yes, it is possible. Assuming your dates are in column A, select all of them, go to CF, new rule and then write something like =Weekday(A1,3)<5 and format it in one color, add one more rule and say =Weekday(a1,3)>4 and set the color for weekend. That is all.
i need a formula in excel in conditional formating, for dates that occure in the last 3 months. (not in the last month)
thanks
@Leonidas
Try: =M10>=EDATE(TODAY(),-3)
adjust M10 to be the first cell in your range
Really useful…far more helpful that MS Excel help facility…thanks.
I NEED AN EXCEL FOR DUMMIES ANSWER. I NEED A FORMULA TO ADVANCE THE DATE BY SEVEN DAYS. I HAVE 12 EXCEL WORKSHEETS (REPRESENTING JAN-DEC), AND 4-5 COLUMNS PER WORKSHEET (REPRESENTING HOW MANY SUNDAYS IN THE MONTH). HOW CAN I ADVANCE THE DATE FOR EACH MONTH SO I WON’T HAVE TO PHYSICALLY TYPE IN EACH SUNDAY OF THE YEAR (TOTALLING 52 TIMES). PLEASE HELP ME QUICK!!! THANK YOU IN ADVANCE FOR YOUR KNOWLEDGE AND ASSISTANCE.
Im using a Gantt chart with a cell displaying the end date and another cell that displays the completion percentage of a task. I would like a formula that turns a cell red only if the end date is in the past and the completion percentage is less than 100.
@Kevinhttp://chandoo.org/wp/2008/03/13/want-to-be-an-excel-conditional-formatting-rock-star-read-this/
Try Conditional Formatting
apply a formula like assuming
M10: Is Completion date
M11: is Completion percentage
=and(M10
Works like a charm!
Thank you very much.
Kevin
Hi there.
I am trying to use the below formula, but it will not format cells showing dates that have already occured this week.
To check if a date is in the last 30 days:
=TODAY()-A1<30
The formatting should show dates occuring this week but after today in yellow, and cells that contain dates before today and for the last 360 days need to be red. Currently all dates including the past two days are still yellow. Please advise.
Thank you for your help so far, it has been very useful!
I have a chart with a list of dates. I am trying to use cf to colour in the dates which are 3 months from today, I can’t figure out a formula. But I want to make sure everytime the document is opened the date is always updated so that it formats the dates 3 months from the actual current date. I hope somebody understands what I mean so my question can be answered. Please help!
@Norah
=Today() = Todays date
=EDATE(Today(),3) is the date in 3 months
.
If you want to know is a Date = today + 3 months in CF
assuming the cell is B4
=B4=EDATE(Today(),3)
Which will be true only when B4 is exactly 3 months after today()
.
If you want to know is a Date between today + 3 months in CF
assuming the cell is B4
=And(B4>=Today(), B4<=EDATE(Today(),3)) Which will be true only when B4 is greater thand or equal to today and less than or equal to Today + months
hi there, thanks for all your formulas they work a treat. however please can you advise on the below. i want to use the year formula, but i need all dates in the past to show another colour. when i use the below formula it overrides the past dates formula:
for this year,
=year(a1)=year(today())
Thanks,
melanie
@Melanie
These formulas aren’t for use on a worksheet, they are for use in Conditional Formatting
So you probably want a formula like
=A1 < Today() which will be true when the condition is correct and hence apply your Format
Thanks for your prompt response.
When I enter =A1 < Today() it is also formatting the empty cells.
I have been using the below, to format cells that are in the past 360 days:
=TODAY()-H7<360
it seems to work.
however, when I use the below formula to format forthcoming year dates, it does work, but it is also over-formatting the past dates that the above formula formats:
=year(a1)=year(today())
How do I resolve this?
Sorry if I am not explaining myself very well! I am not a whizz-kid at excel (in case you can't tell!). Thank you for your help.
@Malanie
You need to apply two or three CF’s to the same range
One for less than current date
One for Greater than or equal to the current date
.
=TODAY()-A1<360 for cells within the last 360 days
=A1>Today() greater than today
=A1=Today() Equal to today
Hi there.
I was about to admit defeat.. but they work! Thanks 🙂
One last question, I need to format dates that occur from tomorrow to sunday, is there a formula for this? I have seen the formula for dates occuring this week – but this formula is not suitable as it overrides the formatting of dates that have passed already.
Melanie
@Melanie
Try
=AND(A1-TODAY()>=0,A1-TODAY()<=6,WEEKDAY(A1,1)=1)
Brilliant. Except for some reason it will not format tomorrow, the 18th, but it will format the 19th! Any idea why?
Change > to >=
I am unsure where I change this, pls advise
@Melanie
Sorry I misread that
Give this a go:
=AND(A1-TODAY() > =0, A1-TODAY() < =6, WEEKDAY(A1,2) > =WEEKDAY(TODAY(),2), WEEKDAY(A1,2) < =7)I am trying to create a Formula using Conditional Formatting … I have the 1st 2 parameters which are >30 days from today the Cell turns Green ; <15 days the Cell turns Red ; what I need is the formula for what's between 15-30 days to turn Yellow
Kimberly
it will be like this
=and(x>=15, x<=30)
Hi Hui,
Thanks but that didn’t seem to work … here are the exact formulas that I am using
Due Date is more than 30 days out … (B1-TODAY())>30 … Cell Turns Green
Due Date is less than 15 days out … (B1-TODAY())=15,B1-TODAY()<=30) am I missing a ( ) somewhere or something?
Hi Hui,
I even tried modifying the Formula as follows but still no luck
AND((B1-TODAY())=15)
Ooops … my latest formula didn’t post properly AND((B1-TODAY())=15)
I did say it will be like this
=and(x>=15, x<=30)
So in your case it will be

=and((B1-TODAY())>=15,(B1-TODAY())<=30)
I have to 2 adjacent columns- projected date and actual date. And need to highlight the actual date which is greater than the projected date.
Any help will be appreciated.
Thx
@Djain
I’m going to assume that
Projected Date is Column C
Actual Date is Column D
.
Select Column D
Conditional Formatting
Apply using a Formula
=$D1>$C1
set format
Apply
.
Adjust columns to suit.
Hi, I understand how the concept of this works.. but I’m having issues doing this:
I have 2 columns – a start date and an end date.
I’d like them to highlight if TODAY’s date falls in between those two dates.
Looks like this:
A1 B2
8/7 9/24
Today’s date falls between that – so I’d like both cells to highlight.
I did this statement, but it’s not highlighting both cells:
=AND(TODAY()>=A1,TODAY()<=B2)
@JTiff
Are you sure that =AND(TODAY()>=A1,TODAY()<=B2) is correct? maybe it should be =AND(TODAY()>=A1,TODAY()<=B1)
I would like to get YESTERDAY intead of TODAY. =today-1
The tricky thing is that I only need works days. I mean, if today is wednesday give me tuesday in date format, but if today is monday, give me friday.
any comments?
Thanks in advance!
hi dear I only need works days. I mean, if today is tuesday give me monday in date format, but if today is monday, give me saturday.
@Antonio
What about:
=TODAY()-IF(WEEKDAY(TODAY(),1)<>2,1,3)
In my Excel this works fine:
=WORKDAY(TODAY(),-1)
Both formulas work fine.
Thanks a lot.
Good morning. I hope you can help me on this:
In a cell there is a date (expiration date of certificates) . . . in the cell next to it I want to have a remark that will automatically refer to the date and show if it is “Still Valid”, “For Renewal”, “Expired” or “Not Specified”. How can I do this using Conditional Formatting?
Thanks in advance!
@Franz…
Assuming the date is in A1, You can try this:
In the next cell, write
=IF(A1="", "Not Specified", if(A1>today()+14,"Still Valid", if(A1>=today(),"For Renewal", "Expired")))
This displays the text you want. Then, you can apply conditional formatting and color the values based on what they are.
Thank you very much Chandoo,, it’s a great help.
Have a great day ahead.
Hi there,
I would like to format a column with dates in it so that if today’s date is within 30 days of the date in the cell it will change color. Can you help me with this please?
I’m checking the date in Col. B2 if it’s more then 4 days ago (then todays date), if it is I’m setting the “fill” to red in Col A2 using this formula in Excel 2007 (using Conditional Formatting on the Home tab)
=TODAY()-B2>4
but if col B2 has no date (is blank) then col A2 is set to red – which I do not want. Can somebody help me, please
Hi there. Am hoping you can help
I have 3 columns. First if date of employment, 2nd is a date which is end of contract and the third is remark. The third column, I want a remark that will automatically refer to the end of contract date which could be “End of Contract”, “To be Started”, “For Rehire” and “On-Going Contract”. How can I do This? Please help..Thanks!!!
HI, this is a great forum site. All question has been answered beautifully. My question is, I could I highlight all days that falls in friday in a calendar. I created a calendar but when i tried to highlight all the fridays using conditional formating and I selected the option equal to (text) friday it didnt highlighted any cells. please advice. Thank you.
I’m having a problem using the conditional formatting. Let’s say I have a list of apartment leases that expire on different dates. How can I make each expiration date highlight as a different color depending on if they expires within 30, 60 or 90 days?
Here’s what I’ve tried so far. I’ve pasted the below formulas into the rules within the conditional formatting. The problem is, it colors some of the cells but misses others. Even if they have the same date. Any help would be appreciated.
G4=lease expiration date
=AND(G4>=EDATE(TODAY(),0),G4=EDATE(TODAY(), 3),G4=EDATE(TODAY(),6),G4<EDATE(TODAY(),9))
@Steve M
Select your range of cells which you want to apply a Conditional Format to and clear the existing CF’s
You will need to add a few CF’s to the range
They need to be added so that the logic is correct in the order which they are listed, this can be changed in the manage CF dialog.
Assuming your Dates are in G4:G20
The CF’s will be like
.
=Today()+90
Your formula to return TRUE or FALSE to evaluate when a given date falls within the current month is excellent. However I need to be able to identify all dates that fall in the current month or the next month. Is there a way to combine so that one formula can highlight these dates accordingly?
@Nancy
Yes
Try this
=AND((A2>=EOMONTH(TODAY(),-1)+1),(A2<=EOMONTH(TODAY(),1))) adjust cell ref to suit
That works great- thank you so much!
Hi there, Similar problem to Kish for me, and couldnt see an answer to his queire. . .
I have a column of data that I am formatting so that if it is above a certain percentage, then go one colour and below another percentage go a different colour. However, some of the cells in the column do not have data in them, but are still coloured as if they are below the benchmark percentage. I do not want these cells to be coloured. do i need to write a formula for the cells, or is there another way? I dont not want to have to individually delete the conditional formatting in each cell where there is no value
Many thanks in advance
@Fred
Add a Conditional Format so that cells value <> “”
eg: =A1<>“”
I want to format a range of cells (day 1 to 30 or 31 of any given month) in one column. Any given date (within the given month) will appear either none, once or multiple times (no limit of occurence) all on the same column. I want to group the occurence of these dates by color coding within each week they fall as determined by another range of cells (ex Sep 30, Oct 7, Oct 14, Oct 21, Oct 28, etc – this range is also in date format).
I can do it with conditional formatting but I am limited to 3 conditions only which means i can color code up two 3 weeks only. (I am using office 2003). How can I possibly extend conditional formatting to at least 6 without using vba, anybody please? Thanks in advance!
@William
You can use a combination of Conditional Formatting (CF) which will allow 4 formats (3 Conditional + the Default Format)
In the Default area you can use a Custom Number Format to say Change the color according to ranges
The problem doing that is that it isn’t able to be linked and so each Custom Format will need to be setup manually
.
eg: If your CF handles Sep 30, Oct 7 and Oct 14
you could add a Custom Number format like:
[Blue][=40830]dd-mmm-yy;[Red][=40823]dd-mmm-yy;General
40830 is 14 Oct, 40823 is 7 Oct
.
That will give you 5 custom formats
Hi Hui, thanks for the reply.
However, the data that needs to be color coded is not always equal to specific date only. It must fall within 2 dates. For example, dates from range Sep 30 to Oct 7 is one set, Oct 8 to Oct 14 is another set, and so on. Which means if I have the dates Oct 1, 3, 4, 5, 6, 8, 10 ,14 ,15, if will format Oct 1, 3, 4, 5 & 6 as one color, Oct 8, 10 & 14 as another color, and Oct 15 as another color also.
The conditional formatting I am looking for could also be used to format say for example, a data set containing multiple sets of sequential data (numbers or alphabetic set of data) where a defined range must identify all those data in excess of 3 conditions,
e.g.
numbers
1-10=blue, 11-20=green, 21-30=red, 31-40=yellow, 41-50=orange, 51-60=gray, etc
or
alphabet
a-d=blue, e-h=green, i-l=red, m-p=yellow, q-t=orange, u-x=, gray, y-z=purple
On the other hand, is it also possible to use a combination of = in a custom format?
The last part of my question should read..
On the other hand, is it also possible to use a combination of greater than, less than & equal in a custom format?
Hello,
I am trying to create a log for work and i want to use conditional formatting to automatically highlight rows based on the current week. Ex. It is week 46 of 2011 and I want all rows that have a due date of week 45 to be pink, all rows with a due date of week 46 to be yellow, all rows with a due date of week 47 to be green, etc.. I have a feeling Excel is more than capable of this, but i do not know how to setup the conditional formatting to make it possible.
Thanks in advance
Hello,
How do I use CF to have a cell change color when a date is 5 years old.
@Ray
Select the area of dates
I am assuming A2 is the Top left corner of your date range
Goto CF and use a Formula
=A2<=DATE(YEAR(TODAY())-5,MONTH(TODAY()),DAY(TODAY())) Apply a format Apply
I track service of our trucks. I have created a spreadsheet in which I record mileage and last service date and mileage. Another column has next service due. This could be a date (some trucks are serviced on date intervals) or a number (if serviced on mileage). I’ve been trying to conditional format this column but can’t get it right. I want dates before today to be red (mileage less than 0 automatically are red) – showing overdue, dates between today and 30 days or mileage between 0-500 to be green (due now), dates 30 days or more and over 500 miles no formatting needed. Everytime I set these conditions, it changes everything to red or doesn’t format at all. Any ideas?
How do i conditionally format an entire row based on the value of one cell? I have a formula in place that will change the value of the cell based on the current date, however when the value changes i want the entire row to change a different color for each value. This is the formula in place: =IF(WEEKNUM(NOW())=WEEKNUM(K2),”Current Week”,IF((WEEKNUM(NOW())+1)=WEEKNUM(K2),”Next Week”,IF((WEEKNUM(NOW())+2)=WEEKNUM(K2),”ThirdWeek”,IF((WEEKNUM(NOW())+3)=WEEKNUM(K2),”FourthWeek”,IF((WEEKNUM(NOW())-1)<WEEKNUM(2),"PRIOR WEEKS","Lastweek")))))
When the value of the cell is in its current week i want it to be yellow, next week to be orange, third week to be red/orange, etc.
@Jonathan
You select the entire row
Apply CF based on a formula
You have to add a new CF for each Color you want
eg:
=$A$1=1 apply Red
=$A$1=2 apply Green
=$A$1=3 apply Orange
.
It can’t be done in one pass
@Regina
You will need to add a new CF’s for each Color your are after
Clear all the CF’s then add
=or(DateCell
this is probably obvious, but I just need to know how to conditionally format something based on a static date entry. I.E. I want to highlight cells occurring on or after 1/1/2011. this date will never change, so i want it entered statically, and i’m hoping i don’t have to enter it into a cell as a reference, but can just enter it directly into the formula somehow. Any ideas on the syntax for this? Do i just use the date code?
Nevermind, answered my own question. Date code it is. For others wondering, I picked formula, and entered the following: (data affected is in column d)
=D2>=40544
Formula applies to D:D.
40544 is date code for 1/1/2011. This can be ascertained by changing cell format to number temporarily. once you get the number for your static reference date, you can change the format back to the date type.
I have a spreadsheet that tracks days off for employees (sick days, vacation, jury duty, etc.) and I have the sheet set so that it automatically does a running total for me AFTER the week has occurred. The cells do NOT have dates entered in them. Below is a portion of the formula that I use to track the data
=IF(NOW()>40915,COUNTIF(Paul!E13:H13,”=V”)+COUNTIF(Paul!E13:H13,”=0.5″)/2+COUNTIF(Paul!E13:H13,”=H/V”)/2)+IF(NOW()>40922,COUNTIF(Paul!K13:O13,”=V”)+COUNTIF(Paul!K13:O13,”=0.5″)/2+COUNTIF(Paul!K13:O13,”=H/V”)/2)+IF(NOW()>40929…..
I have CF applied to these cells to change the color based on the text that is entered (i.e. “V” is filled with yellow, H/V is filled with gray) and it works just fine. How do I change the CF to apply only AFTER the current date has passed? I’ve tried a variation of my “If(now” formula, but CF doesn’t allow it.
=and(DateCell>today(), existing CF)
@Hui
I tried the formula you posted but all it does is turn the area I have the CF set for yellow, irregardless whether there is data in the cell or not.
I want to try and set the CF the same way I have the totals set, where once the week has passed, the CF applies to the range of cells based on the criteria I have set. I DO NOT HAVE DATES IN THE CELLS OF THE SPREADSHEET. The spreadsheet is setup where the dates of the months are a header row for each quarter. Is this something that cannot be done?
@Denise
Can you email me the file with instructions on what you want to achieve
My email is at the bottom of the page when you click on my name
@Hui
I have sent you the file. Thank you for your help!
Hai all,
I need a little help here. I am having data in 1 column let says A1 to A35. On cell A1 i put complete Date and time format (13-Dec-11 20:00), A2 downward are =A1+”01:00 with time (hh:mm) format only. After some cell downward, i will find the value of the cell is 00:00 which is actually 14-Dec-11 00:00. I want to make the format on this case will be full Date and time format, but i don’t want to edit the format manually because i might change the A1 value with different date and time. I looking for kind of “IF” function with this issue.
Please help and my email is ris76122@yahoo.com
@Arie
Select the data
Format the data using a Custom Number Format
Ctrl 1
Format Cells
Number
Custom
and use a Custom Format hh:mm
Apply
.
Now select the data again
Add add a Conditional Format
Use an Equation
=DAY(A2) << >> DAY(A1)
and apply a Custom Number Format as d/mm/yyyy hh:mm
.
Enjoy
Hai Hui,
Thanks for the tips, but i have tried your formula and it’s showing pop up message saying the formula contain error. Any idea?
Thanks,
Arie
@Arie
(This seems too late but in case you haven’t found the answer yet)
I think what you are trying to achieve is only to add one hour increment on the date and time entered in cell A1 which you already did by the formula +”1:00″.
To format the cell A1 as you have described above, go to format menu > cells (or Ctrl + 1 via keyboard) then select the number tab, from the categories select custom then type the following:
d-mmm-yyyy hh:mm AM/PM
If you have already displayed A1 as described here, just copy Cell A1 then paste special to cells A2 until the last row. From the paste special screen, select Format.
Hai william,
Thanks for the reply. What i am looking for is; i need to set the complete DD-MMM-YY HH:MM only on new days/date.
For examples;
if my A1 is 15-Mar-12 22:00, i want in A2 is only HH:MM (23:00) and again on A3 it will be 16-Mar-12 00:00.
Since i might change the date and time on A1, so i am looking for formula which i can put any date and time in A1 with increment of “01:00” for next raw with HH:MM format, but on the raw when the date is change i want it to be on full format DD-MMM-YY.
Hope you get my point and can help.
Hi,
I am trying to figure out which formula i need to use. I have a date in I5 and I need the cell to the right of I5 to highlight red 14 days after the date in I5.
Thanks for any help!
@Cynthia
Select J5
Goto Conditional formatting
New Rule, Select a Formula
=Today()-$I$5>=14
Set the format of the cell using the Format Button
Apply
I have a column with a set of dates that are mostly in the future. The dates when people’s accreditations will expire. I want to be warning 6 months in advance of the expirey date. The built in Conditional and Formating only goes to a month. What’s the best way to do this?
Thanks in advance
I have a column with a bunch of dates that are in the future. These dates are when people’s accreditations are going to expire. I would like to be warned 6 months prior to the expiry.
What is the best way to do this?
Hi
I have two spreadsheets, one that contains a running total week by week, the other that pulls in totals.
I need to enter a formula in the one that pulls in the running total for the month based on todays date.
Any help you can offer would be great.
Thanks
AM
I have a cell with a date in it.
In the cell next to it I would like it to show how many weeks ‘late’ that date is?
i.e 1/2/12 is now one week late so the cell next to it show ‘1’ and in another weeks time it will show ‘2’ and so on….
Thanks
@Kyle
what about something like?
=INT((D2-C2)/7)Where D2 is the latest date and
C2 is the older date
Hello,
I have a column of Expiry dates and I would like the date to change to red once the date is past. how can I use the Conditional formatting tool in Office 2007 in order to do this please?
Regards,
Maria
@Maria
Lets assume your dates are in Column A from A2:A100
Select the dates from A2:A100
Goto Conditional formatting
New Rule
Use a Formula
Enter the formula =A2
Hi ….I have a column AE fillled with dates, i want this column to change colour if date becomes older then one week from current date.
thanks
@Nabbel
Select the dates in Column AE, I assume AE2 is the top most Date
Goto Conditional formatting
New Rule
Use a Formula
Enter the formula =AE2 < Today()+7 Assign a format Apply
@Hui
thank you very much Hui.. it worked perfectly.. 🙂
The only problem is.. if any cell in that column is left blank then..formatting does not work… it is only working if entire column is filled with dates with no blanks….
hope you can help me again … 🙂
AND FORMULA ONLY WORKS IF DATES ARE IN A SEQUENCE.. IF THEY ARE NOT IN SEQUENCE…CF DOES NOT WORK
How could I use CF to track (1) all dates that are greater than today’s date (2) All dates that are past due and (3) dates that will expire this month?
@Chelsea
You will need to add 3 CF’s one for each condition
Assuming your data range is A2:A10
select the range A2:A10
1. All dates that are greater than today’s date
Goto CF
New Rule
Use A Formula
=Today()-a2<0
set a format
2. All dates that are past due
New Rule
Use A Formula
=A2=TODAY(),A2<=EOMONTH(TODAY(),0))
set a format
Stop if True
It is important that they are entered in this order and the Stop if True is enabled where noted, as otherwise the later conditions will override the earlier conditions
I would like to know a formula(conditional formatting) to find out the year that appears frequently.
please Help,
i have have prepared a spreadsheet showing clients,amount paid and duration of service. i need a formula that would notify me if a client’s subscription is valid, due for renewal or expired. How will i do this?? your assistance is highly appreciated
hello please help,
i have a spreadsheet showing client’s name, amount paid and duration of service. i need a formula that would notify me if a client’s subscription is “valid” , scheduled for “renewal” or has totally expired? your assistance is appreciated
Hi I am new with excel and in need of help. I have a list of percentages (currently at 0%) which represent the completion of construction. I need the percentages to turn red if they are less than 100% by a specific date. For example if the percentage is still at 0% when the construction was meant to be completed on 05/03/2012 then the number needs to turn red. Is there any way of doing this? Thanks in advance for any advice!
Hi. Amazing site. I have read all comments and found a few that were close, but not quite right.
I have a sheet with colums that online classes were taken. I want to auto higlight each cell in the column when it becomes >11=12 months old another color, and dates<11 months another. This is so that I know when they have to retake the class. Please advise.
I need it to be for the entire column, different dates in each cell.
Thanks in advance.
@Wade
You will need to add 2 CF’s
1 for each of the 2 conditions
Select the Range assuming A2:B100
The 1st CF will be =A2 < TODAY() The 2nd CF will be =A2 < DATE(YEAR(A2),MONTH(A2)-11,DAY(A2))
I dont know why, but it returns all cells to be the formatted color fill. Do I have to adjust anything in the formula you gave me? I am using =$C$2:$D$210 for the range.
Inside that range it has dates like: 27-Sep-10 17-Oct-11
11-May-11 11-May-11 10-May-11 11-May-11
28-Sep-11 7-Nov-11 30-Jan-12 31-Jan-12
6-May-11 9-May-11
I need to have the cells turn red for the date that has past a year. I need the cells that are still within the year after the class date to be green. I need the cells that are between 11/12 months to be yellow.
I am selecting the range;going to CF; new rule; use formula; entering your formula as above; formatting to turn red.
I have been fighting this uphill battle for some time now. Please help.
@Wade
Try changing the order of the 2 CF’s in the CF Manager
if that doesn’t work please email me the file
Hi,
I need to format cells based on date and current / expired.
I’ve got a cell that automatically updates to show’s today’s date, and can format cells in a collumn which contain dates ealier than this, but I only want to highlight them if the cell next to the expired date contains a certain word (Active). Ive tried using AND and IF, but can’t get anything to work.
@Kate
Assuming your data area is A2:B100
The Conditional Formatting CF will be using an equation something like
=And(A2 < Date, B2 = "Active")
Hi,
I want a formula which colors the cell, whenever the date written in that cell is overdue (based on the today’s date). I need this in order to have a better preview on the tasks that are overdue by date.
I tried formulas like: A1>date() or A1>now(), but nothing happened, even if the date was already due.
I’m using x-cel 2007. Pls help. Thanks
I need a formula that will generate dates in two columns; One 30 days post date in A2 and one thats 45 days prior then A2.
@Jaqueline
Do you want to cells that show
=A2+30
&
=A2-45
or a list of all dates between the two ?
I’ve used the CF to highlight due date cells to red if the due date is past today [cell value less than =NOW()], yellow if due date is between today & 30 days from now [cell value btwn =NOW() and =NOW()+30]. However, I have a separate column with completion dates. How can I format the due date column to NOT be red when the date is past today IF the completion date column has a date in it?
@Tracy
You can use something like
=and(Condition1, Condition 2)
so both need to be True for the CF to work
Can you send some more details of what cells and values you are using
Hi There, i’ve read through every single one of these posts and i’m not sure i’ve located the answer i need.
Ok so i’m trying to conditional format the following.
The whole of column K will have dates inputted, these dates will vary dependant on inspection timescales and guidelines.
Principally what i want is that all of the dates show green, when they are coming within a month of the due date they show yellow, and when they are within a day of the date or expired they will show red.
Can anybody provide the formulas for this please?
I am a real newcomer to Excel and the other posts confuse me, although probably answer my questions. Can somebody provide me with the CF formulas for the following which I need to add to a long column of dates in Excel 2010.
Cell turns Red if prior to todays date
Cell turns Orange if 14 days before todays date
Cell turns Orange if 60 days before todays date
Many thanks
Keiley, Suggest please use conditional formatting with 3 rules added, for further details, check the start of the page on how to do the same,
Regards, Nagesh
Hi,
I am currently trying to get a cell to turn red yellow or green dependant upon if another cell has a value on and if it is after a certain date example will explain it better:
I have cell A1 with a “C” for Critical “R” for Reccomended and “O” for Optional. In Cell A2 i have a date. I need to use conditional formatting to make the cell turn Red if it is “C” and more than 3 months after the date.
Yellow for “C” and 6 months after the date
and Green for “O” and 12 months
the code i have and doesnt work is: =AND(TODAY()-A2>90, A1 = “C”)
why is this not working and yes the format is set to red and the data in the cells is : A1 = C and A2 = 24/05/2012
The dates will all be different and i dont quite understand the TODAY function will this work correctly i need it to go from 90 days past the date set not todays date
@Tmus5
There is something wrong with your formula
but the one below works fine:
=AND(TODAY()-A2>90,A1="C")Looks like the ” characters are wrong in your formula
If you have copied the formula from a web site always re-type the ” and – signs
They sometimes get scrambled for characters that look right but aren’t
How do i go about having a fixed date..
For example, as i’m going to be saving a spreadsheet each day, I can’t really use the TODAY function, I have a separate cell which i am going to enter the relevant days date.
What i am trying to create is a way of using conditional formatting to look at the DATE in the cell, and then on the data in cells and if the date in the cells is 15days over the date in my cell, i want it to change brown,
And after 30 days, change red.
I can do this with the ‘TODAY’ Function, but I need it to work on a specific date, not ‘TODAY’ Date, though it would be today, but it needs to be fixed
I’ve tried this
=$H$2< ($W$2()-15)
with W2 being the cell fixed with a date i wish to use
still does not work! can anyone help… :'(
Hi,
It’s been an educating forum.
please all, I want to format my worksheet as a date tracker to do this:
For each succeeding day, 2working days will be added to give the required date for the cell.
I am trying to create a formula to make all dates red that occur after the 8th of each month, is this possible?
Trying to determine in a year which monthly reports were submitted after the due date and this way, the date would jump out more if the color was different. Thanks in advance for any assistance.
@Carla… assuming the dates are in A1:A10, select them and go to conditional formatting > New rule.
Select rule type as “use formula…”
Then, type =day(A1)>8
Format in whichever way you want.
Click ok and close.
I am trying to CF an entire column with varying completion dates. I would like those dates to highlight in red once they are 2 years old. How would I go about setting this up?
@Kristopher: Assuming the dates are in A1:A10
For more on this, refer to http://chandoo.org/wp/2012/05/22/highlight-due-dates-excel/
I have a spreadsheet that displays training: DATE TAKEN and EXPIRY DATE. I need a formula that will highlight cells BETWEEN 3 months and expiry date yellow. Then I need a formula that will hightlight (in red) when the current date has passed the expiry date. I need blank cells to remain blank. I’ve scanned this entire site for a formula that will do this and nothing works so far or it highlights all blank cells a certain color. pls help.
@Johnny… You can add a condition to check if a cell is a blank or not using something like this:
=AND(cell<>””,date_condition).
For more refer to, http://chandoo.org/wp/2012/05/22/highlight-due-dates-excel/
I have a column [EndDate] and I would like to highlight the column red should the date entered in that column be less than today().
So, how do I write the conditional formula for this() cell? Your example assumes the date is in cell A1, but I want my formula to cover all the cells in the same column.
=Today() – thiscell() < 0
What goes in thiscell()?
Hello! I want to automatically transfer my one cell value to another cell if date is greater then 31 and month is 1… Likewise on date 28 of month 2.. I want Formula for that can anyone help me For generating this Formula! Thanks A lot!
=If(Day(A25)>31 AND Month(A25)=1, A20 = C20, A20 = A20)
Friend.. Salman
I have a list of dates all weekdays of the current month I have extra cells sometimes since there’s more weekdays some months than others and cause of this the weekdays run into giving me a few dates into those few extra cells how can I stop those dates being displayed once the first weekday of the next month is reached?
Hello,
I need a formula to highlight the cell once a given date has past 5 years, and another one when the 5 years – 30 days is coming up. Is this possible?
Basically, 2009-02-25, turns red once it passes the 5 year mark, and then yellow once it is 30 days from the 5 year mark…
I use 2003 excel and I have read and tried multipy diffrent conditional formatting replies. However it does not appear to work. I am trying to do (For example) column E Row 1237 I need 30 days from what ever date I enter the information in that cell to highlight in 30 days. I have tried formula First condition formula is is=isblank(E1237)=TRUE Second Condition formula is -TODAY()-E1237=1237 & Third Condition Cell value is =AND(E1237>=TODAY(),E1237<=EDATE(TODAY(),1))
What am I doing wrong?
Hi, I may be a bit late in posting to this thead, but I’m trying to create a schedule for 2014 for work. I’d like for the weekends and holidays to automatically fill so no one can be scheduled on those days. I was following another how to post where it gave me conditional formatting based on weekday date, but it doesn’t seem to be working. I’d like to input the start of the month in the worksheet and just have the highlighting auto adjust to the correct days for the weekends. I hope I’m explaining this okay. Any advice?
I should add that all employees are down the side and all the days for each month go across the top. I don’t have these in date format, but I do have the beginning date of the month on the sheet. I’d like, for each year, just to be able to update the month/year on the spreadsheet to have the weekends highlight. Please help!!!
I am trying to take a cell that contains a date and have the cell turn yellow when today’s date is within 14 days before that date and red if today’s date matches or is after that date. If today is 6/24/13, then a cell with an end date of 7/5/13 should be yellow…and a cell with an end date of 6/23/13 should be red.
Does that make sense? Please help!!!!
@Malia
You need to apply Conditional formatting to the cell
select the cell, I’ll use C3 as the example
Home tab
Conditional formatting
New Rule
Use a Formula
=C3 < TODAY()-14 Apply a Yellow Format Then apply a second CF New Rule Use a Formula =C3 > = TODAY()-14
Apply a Red Format
Hi ,
I am having problems with the following and would appreciate the help!
I have a table and I need to highlight a date red if it is in the past, I also need to highlight the date orange if it is within the next 8 weeks AND has no date in another cell.
Any help would be great thanks
Assuming the date you want to highlight is in cell A1. The other cell you check whether there is anything is in B1. I am also assuming you are looking for next 8 weeks as in next 56 days.
You can use two conditional formatting rules.
Rule 1: Highlight the cell red if =$A$1<TODAY()
Rule 2: Highlight the cell orange if =AND($A$1=TODAY(),$B$1=””)
I am sure there are other ways to do this. Hope this helps.
Hi
I am trying to create a timesheet for employees and I need to highlight if a time range falls within or overlaps a time range. eg an employees start time in one cell A1 is 09:00 and finish time in A2 is 16:00 therefore the total in A3 is 07:00 (7 hours worked). They then work overtime but enter on the sheet in start time in cell B1 15:00 and end time in cell B2 17:00 and the total in cell B3 is 02:00 (2 hours overtime worked). However they can’t obviously start working overtime until after they finish their normal shift at 16:00 therefore the time in cell B1 is obviously wrong. I would like cell B3 (total overtime claimed) to turn red in this instance as there are conflicting times
Hope this makes sense and hope you can help
Thanks
Lorraine
You can add conditional formatting to cell B3 using the formula $B$1<$A$2
i.e., Start time for overtime < End time for normal shift
If you need to do this for multiple employees, we can easily replicate that. If you would like any help, please drop a comment.
Thanks for info, have got it working now!
I am trying to write a condition for a range of dates to turn a color if they are within 30 days from the current date and turn another color if the current date has passed.
@Michael
This question has been answered a number of times
Please read the previous comments above eg: Malia’s Question
Hi, I have multiple dates for licences that expire anywhere between 1 week and 5 years ahead. What formula can I use so that they stay green if in date. Amber in the last year and red when expired. I am using excel 2003
Hi, I have a excel 2003 spreadsheet with a mixture of dates that are due to expire anytime between a week and five years ahead. I need them to turn red when overdue, turn amber when within the last year and stay green when in date.
For example a certificate expires in 01/07/2016. I would need it to go amber on 01/07/2015 and red on 02/07/2016
Hi, do you have formatting that applies to this situation:
A value is expected to be entered into a cell during 15th and 30th day of the month (e.g. two equal payments). A cell will be highlighted when no data is entered into these cells on those dates.
Hi
I will appreciated for answer to questions. I have excel with due date eg 12-10-13 which have open with late and open with not late. How can I set the conditional formatting with 2 colors.
thanks
@Lyka
You want to use CF Formulas like:
=and(Today()>=Date(2013,10,12), A1=”Late”)
and a second CF
=and(Today()>=Date(2013,10,12), A1=”Not Late”)
What I am trying to do is a bit more complex. I have one column with a planned date on it. The second column has an actual date.
I have conditionally formatted all other requirements except this final one:
If column O’s date is older than today but is not blank, #N/A, – etc, and Column P of the same row is blank, then format the date in column O.
I have tried and failed on these formulas:
=IF(AND(O3<NOW(),O3<=NOW()-1825), (P3″”))
=IF(AND(P3″”),O3<NOW(),O3<=NOW()-1825)
Any help would be most appreciated!!
Heidi
I have a sheet for certificates, expiry date of certificates in One column. I wanted to Highlight he color of the CELL if the date will expire in coming 02 months.
I have a column with historical dates from 2010. It is literally a new row every day since 2010. I would like a formula that will highlight the LAST day of each month since then. Just the last day.
@Ahmed
Assume your data is in B2:B100
Select B2:B100
Conditional Formatting
New Rule
Use a Formula
=B2=Eomonth(B2,0)
apply a Format
Apply
Sorry I meant I actually need the macro for it. I have done the conditional formatting, whereby I highlight the end of month data. I need a macro that allows me to do this as well as delete all irrelevant rows (everything else except highlighted row)
@Ahmed
Try:
Sub Delete_Rows_Unless_EOM()Dim LR As Integer
Dim ColNumb As Integer
Dim i As Integer
ColNumb = 1 'Set the Column Number of the Column with the dates here
LR = Cells(Rows.Count, ColNumb).End(xlUp).Row
For i = LR To 1 Step -1
If Application.WorksheetFunction.EoMonth(Cells(i, ColNumb), 0) <> DateValue(Cells(i, ColNumb)) Then _
Rows(i).Delete Shift:=xlUp
Next i
End Sub
Thank you so much Hui, with a little customising, I got it to work on my sheet perfectly.. I cant thank you enough. I have another question but it is not related to conditional formatting. How can I ask you?
Ask questions in the Forum’s
http://www.chandoo.org/forum
How do I make a formula that tells me when the date on the form is 35 days away or less?
Assuming the date is in A1,
this formula tells TRUE if the date falls with in 35 days or less.
=A1 – TODAY() <=35 See this for more - http://chandoo.org/wp/2012/05/22/highlight-due-dates-excel/
I’ve been reading the comments and whilst a number of users have posted the question I’m about to ask, none of the answers work or haven’t been answered fully. I’m using Excel 2013 My query is as follows –
Could someone explain how I would –
1. Make from Todays date to 14 days to be red.
2. Make from Todays date from 14 days to 28 days to be orange; and
3. Make from Todays date from 28 days onwards to be green
My dates are in column E4.
Any help on the matter would be greatly appreciated.
Regards,
Hai
@Hai
Can you post your question and a sample file in the Chandoo.org Forums
http://chandoo.org/forum/
i have a list of dates with other corresponding data (most of them are similar) but some are in A1000s cell some are in A20s. what i want is to automatically fill the cells with different colors eg . 01-12-2014 with red, 02-12-2014 with blue and so on when i type the date. though i could fill it by filtering or manually i want it automatic. it would take less time.
please help with = function … less knowledge in VBA
thanks in advance.
@Wahid
Can you ask the question in the Forums and attach a sample file to make answering easier
http://chandoo.org/forum/
Hi, hopefully you can help me on my problem.
At column A1 to A10 i wanted to embed photo for each cell, so that when I filter to show only A2, A4, A6, A8, A10 it will show the photos embed to the cell mention above. Thanks
I am trying to come up with some conditional formatting for a series of dates, but I can’t figure out how to do it.
I have a range of different dates in cells E3 to E12 which all range from the last 3 months or so and I want each of those dates to be highlighted red, if todays date is greater than 120 days from the date in each corresponding cells from E3 to E12.
e.g.
IF Today is greater than E3 (31/01/2015) + 120 days, show E3 as red
IF Today is greater than E4 (18/02/2015) + 120 days, show E4 as red
etc etc, right down to E12.
I want to do this with one conditional formatting across the range, not separate formula for each cell, is this possible?
I want to date Cell (column A) contains referents dates should automatic higlight after 60 days from date what in Column A
I’m curious to find out what blog system you are working with?
I’m having some small security problems with my latest blog
and I’d like to find something more secure. Do you have any solutions?
@Educate
have a look at:
http://chandoo.org/wp/about/what-we-use/
Hi,
I have a problem in the excel sheet. The employee Attendance record of excel 2016, the weekdays are on SAturday and sunday. I did the CF and made it to Friday and Saturday which is required in my Company. But the formulas don’t work with this. I mean the dates counted as vacation.
@Shelly – Use WORKDAY.INTL and NETWORKDAYS.INTL formulas to set custom weekend as per your company policy.
Hi I need to highlight E9 down the colum as this is my expiration date, i need to show different colours for 15days past expiration and then 90/182 days and so on to 36 mths. a different color or shade for each? i have tried but cant seem to get it to work? Help?
I have a client list with expiration dates, listed in mm/dd/yy format. I use conditional formatting for periods of time: Last Month, This Month and Next Month.
Using the drop down it’s worked perfectly until now in December. “Next Month” does not find any January date. Is it because next month is a new year? How would I change the formula?
Thanks much
I’m trying to turn a cell red where the date is less than three days from now and orange if it is a week from now.
Can anyone help with these formulas?
I am struggling with highlighting dates that have expired within the last 6 months. I have tried using =EDATDE(TODAY(),-6)
within the excel conditional formatting feature but it is only highlighting empty fields currently and there are some relevant values within the data. Can anyone suggest anything?
Thanks
Formula in Conditional formatting:
AND($A1>=EDATE(TODAY(),-6),$A1<=TODAY())
assuming your dates are in column A from A1 down. This should highlight dates from 6 months ago (from today) to today. Please try and reply if this does not work. Best wishes
Hi all,
I am currently working on composing a spreadsheet for work that will provide me with alerts for approaching deadlines – 10 days after an input date, and 48 hours before the deadline (the 10 days). While I have attempted several different formulas, none of them are quite giving me what I want, which is:
>>To provide me with a color coded alert (yellow) when the 48 hour (before deadline is up) is met. This would need to be Mon-Fri only (workdays)
>>To provide me with a color coded alert (red) when the 10 day deadline (this would need to count the day of the date – so, for instance, if I issued a notice to a client on 1/1/2016, I would also include 1/1/2016 in my count of 10 days.. so the deadline would be 1/10/2016).
Can someone please assist me with this issue? All suggestions are definitely welcome.
Thanks much!
Great website. Plenty of useful information here.
I am sending it to several pals ans additionally sharing in delicious.
And obviously, thanks in your sweat!