All articles with 'Charts and Graphs' Tag
{ 62 Comments }
What are Excel Sparklines & How to use them? 5 Secret Tips
Published on Apr 23, 2020 in Charts and Graphs

Of all the charting features in Excel, Sparklines are my absolute favorite. These bite-sized graphs can fit in a cell and show powerful insights. Edward Tufte coined the term sparkline and defined it as,
intense, simple, word-sized graphics
Sparklines (often called as micro-charts) add rich visualization capability to tabular data without taking too much space. This page provides a complete tutorial on Excel sparklines.
Continue »{ 37 Comments }
5 simple rules for making awesome column charts
Published on May 9, 2019 in Charts and Graphs

For every column chart that is done right, there are a dozen that get messed up. That is why lets talk about 5 simple rules for making awesome column charts.
Tip: Same rules apply for bar charts too.
Continue »{ 43 Comments }
Visualize state to state migration data and you could win an iPad or Galaxy Tab [Datavis Contest 2014]
Published on Apr 9, 2014 in Excel Challenges
![Visualize state to state migration data and you could win an iPad or Galaxy Tab [Datavis Contest 2014]](https://chandoo.org/wp/wp-content/uploads/2014/04/chandoo-datavis-contest-2014-prizes.jpg)
Time for another dashboard contest. Sit straight, set aside your appointments and get number-crunching.
Analyze state to state migration data between 2012 & 2010 and present your results in a dashboard (or charts) and you could walk away with glory, fame & and an iPad.
If all of this sounds tempting, read on.
The contest
- Download dataset for the contest [mirror]
- Analyze the data and create a dashboard or set of charts (see rules below)
- Submit your workbook by 20th of April (Sunday), 2014.
- If readers at chandoo.org and our panel of judges love your work, you get one of the cool prizes.
{ 7 Comments }
Last day for enrollments – Join our Power Pivot class & become awesome analyst
Published on Aug 16, 2013 in Power Pivot
 Hi folks,
I have a quick announcement & a creative dashboard to share with you. First the announcement.
Only few hours left to join our Power Pivot course…
As you may know, I have opened enrollments for our 2nd batch of Power Pivot course few days ago. The aim of this course is to make you awesome in Excel, Advanced Excel, Dashboards, Power Pivot & Advanced Power Pivot.
We will be closing the doors of this program at midnight, today (11:59 PM, Pacific time, Friday, 16th of August).
If you want to join us, click here and enroll now.
Continue »{ 109 Comments }
How to create an Interactive Chart in Excel? [Tutorial]
Published on Apr 23, 2013 in Charts and Graphs, Excel Howtos
![How to create an Interactive Chart in Excel? [Tutorial]](https://cache2.chandoo.org/images/c/interactive-chart-in-excel-demo.gif)
Imagine you have a worksheet with lots of charts. And you want to make it look awesome & clean.
Solution?
Simple, create an interactive chart so that your users can pick one of many charts and see them.
Today let us understand how to create an interactive chart using Excel.
Continue »{ 39 Comments }
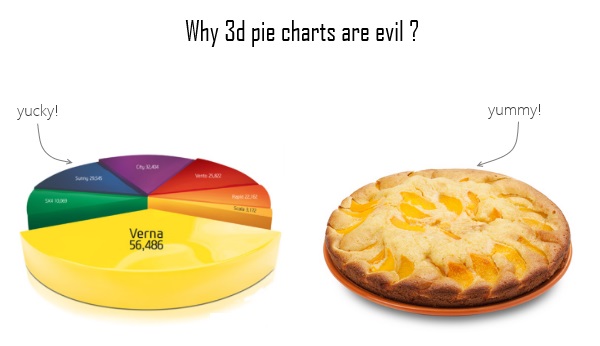
Some charts try to make you an April fool all the time (or why 3d pie charts are evil)
Published on Apr 12, 2013 in Charts and Graphs
Recently I saw a big screaming ad that said “the chartbuster rules”. Of course, I know that chartbusters rule. Not just because I was one of them 🙂
So I got curious and read on. And I realized the ‘chartbuster’ is actually a car, not some cool, spreadsheet waving, goatee sporting dude like Jon Peltier. What a bummer!
And then to my horror of horrors, I saw the exploding 3d pie chart, with reflection effects & glossy colors. And the sole purpose of the chart is to create an impression that Verna sells better than any car in India.
Today, lets talk about this chart and alternatives for it. Read on.
Continue »![How to create interactive calendar to highlight events & appointments [Tutorial]](https://img.chandoo.org/vba/interactive-event-calendar-in-excel.png)
One of the popular uses of Excel is to maintain a list of events, appointments or other calendar related stuff. While Excel shines easily when you want to log this data, it has no quick way to visualize this information. But we can use little creativity, conditional formatting, few formulas & 3 lines of VBA code to create a slick, interactive calendar in Excel. Today, lets understand how to do this.
Continue »{ 63 Comments }
To-do List with Priorities using Excel
Published on Jan 7, 2013 in Excel Howtos, Templates
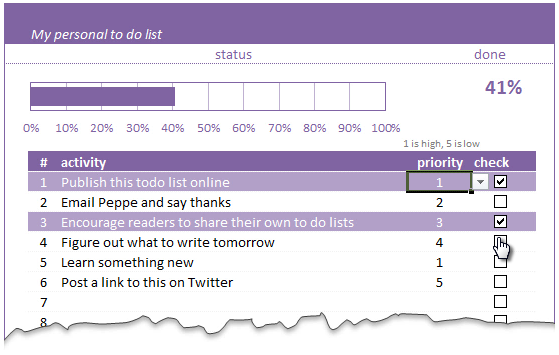
A while ago, we published a new year resolution template. This was a hit with our reader with thousands of you downloading it. During last week, Peppe, one of our readers from Italy, took this template and made it even more awesome.
The original template had tasks and completion check mark. As you finish each task, you can see the progress bar moving.
Peppe added priorities to this. With his new version, progress is measured based on how much priority we assigned that particular task. Pretty neat eh?!?
Continue »{ 12 Comments }
Highlight best week & month in a trend chart [tutorials]
Published on Dec 12, 2012 in Charts and Graphs
![Highlight best week & month in a trend chart [tutorials]](https://img.chandoo.org/c/highlight-best-week-month-in-trend-charts-excel-howtos.png)
When analyzing business data like sales, shop visits or productivity, one of the questions managers always ask is,
What is the best month / week for this data?
To answer this question, we need to make a chart that looks like above. Today, lets learn how to highlight portions of such charts that correspond to best week or best month.
Continue »![Making your dashboards interactive [Dashboard Essentials]](https://img.chandoo.org/vp/grammy-bump-chart-replication-in-excel-demo.gif)
Everyone likes to be in control. Even my 2 year old daughter jumps with joy when she lays her hands on TV remote. She pushes the buttons and assumes it is working. It is another story that we rarely watch TV at home.
By adding an element of control, we can make our dashboard reports fun. Interactive elements like form controls, slicers etc. invite users to play with your dashboard, get involved and understand data by asking questions. That is why I recommend making dashboards interactive.
Today lets understand how you can make dashboards interactive.
Continue »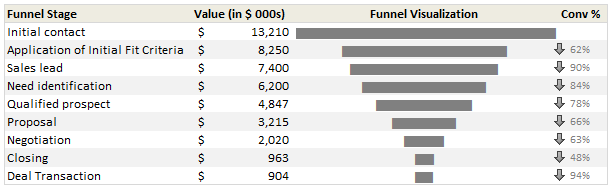
Sales Funnel or Sales Process refers to a systematic approach to selling a product or service. [more on sales process] Whether you run a small business or part of a large corporation, chances are, you heard about Sale Funnel. Understanding & analyzing your sales performance from a Funnel point of view is a great way […]
Continue »{ 12 Comments }
Analyzing Performance of Stocks using Excel [Example]
Published on Sep 21, 2011 in Charts and Graphs
![Analyzing Performance of Stocks using Excel [Example]](https://chandoo.org/wp/wp-content/uploads/2011/09/stock-analysis-in-excel.png)
Last week, we learned how to visualize Suicides vs. Murders data using Interactive charts in Excel. William, one of our readers, took this technique and applied it to Stocks. He emailed me because he has some formula issues with the stock data. Once I solved the problem, I asked him, “Can I share this with […]
Continue »{ 24 Comments }
Suicides & Murders by US States – An Interactive Excel Chart
Published on Sep 9, 2011 in Charts and Graphs, Cool Infographics & Data Visualizations
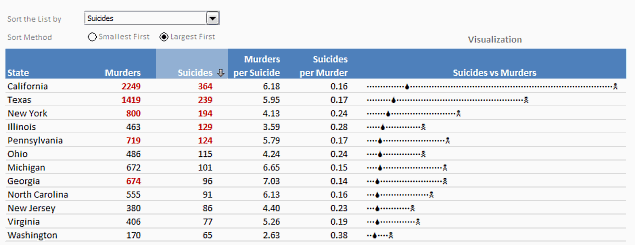
Over at PTS Blog, my dear friend & charting guru, Jon Peltier has an interesting post on using dot plots to visualize Murders & Suicides data by US States.
Not that murders & suicides fascinate me, but I wanted to play with this data myself and see how we can visualize it. So I emailed Jon and asked him to share the raw data. Being a lovely chap Jon is, he immediately sent me the data. So here we are, playing with gory data on a Friday.
Suicides & Murders by US States – An Interactive Excel Chart
You can see a demo of the chart I came up with above. Read on to learn how this chart is constructed.
Continue »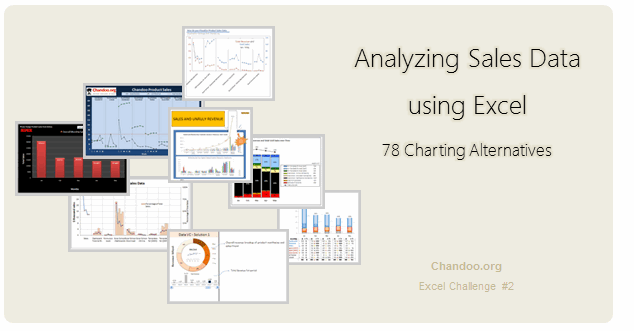
Recently, I ran a contest asking you to analyze a bunch of sales data and present your results in charts. We received a total of 78 charts from 45 people. The contest entries had a mind-boggling variety of excel charts, techniques and ideas. It took me a while to go thru all the files and compile the results. Thanks for your patience. In this post, you can find all the charts along with my comments & links to download files.
Continue »{ 19 Comments }
Automating Repetitive Tasks
Published on Jun 23, 2011 in Automation, Charts and Graphs, excel apps, Excel Howtos, Huis, Learn Excel, Posts by Hui, VBA Macros

Podcast: Play in new window | Download
Subscribe: Apple Podcasts | Spotify | RSS
Over at Newton Excel Bach I spotted the Dynamically Defined Dancing Pendulums. Doug had used Strand7 for the animation.
I thought I could do that in Excel and did.
This post demonstrates some of some basic VBA techniques used to simplify repetitive tasks used during the construction of the project.
For a full project description visit Excel Hero.com.

