All articles with 'Analytics' Tag
Please help me design our new course – “50 ways to analyze your data”

Hi friends & readers of Chandoo.org,
I have an exciting and awesome new training program for you. 50 ways to analyze your data is aimed to give you critical data analysis & charting skills necessary for your success as an analyst (or manager). I want to make sure that this course offers you best content & value. I need your help in designing it. Please take a few minutes to read this short post & share your feedback.
Continue »CP016: 3 Must have books for aspiring analysts

Podcast: Play in new window | Download
Subscribe: Apple Podcasts | Spotify | RSS
In the 16th session of Chandoo.org podcast, lets review 3 very useful books for aspiring analysts.
What is in this session?
Analytics is an increasingly popular area now. Every day, scores of fresh graduates are reporting to their first day of work as analysts. But to succeed as an analyst?
By learning & practicing of course.
And books play a vital role in opening new pathways for us. They can alter the way we think, shape our behavior and make us awesome, all in a few page turns.
So in this episode, let me share 3 must have books for (aspiring) analysts.
Continue »Use Analytical Charts to Make your Boss Love You

There are beautiful, powerful & awesome charting examples all around us. Today, I want to show you how we can harness the power of Excel to create Analytical Charts.
Analytical What?!?
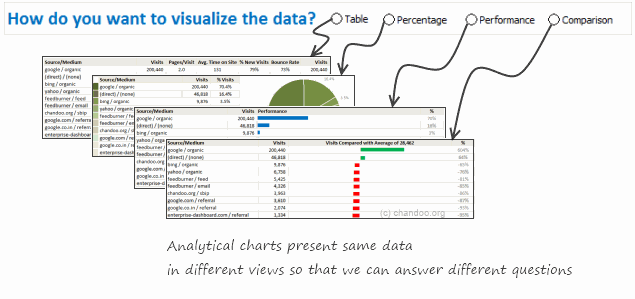
To be frank, I do not know what to call these charts, so I choose the term Analytical Charts. But this is what I have in mind when I say Analytical charts:
A chart is analytical chart,
(1) If it is interactive
(2) It it can answer different questions by re-structuring same data differently
Do you use (or make) Excel Dashboards? Tell us about yourself to win a free training kit

(You can win my latest Excel Dashboard Training kit free, read this post to find out how.)
Over at Jorge’s ExcelCharts blog, he started a very good discussion on Excel Dashboards: Who needs them anyway?.
Jorge has very good experience designing, working on and teaching about dashboards. So he uses all that skill to gaze in to a crystal ball, to understand who needs excel dashboards and why. In this post, I build on his argument and ask you the big question – “If you make or use Excel Dashboards, who are you?”
Continue »Excel Links – Next Dashboard Contest Edition

Almost an year ago, we had a memorable dashboard contest on Sales Dashboards. We got 32 beautiful, outstanding, well crafted entries and it was a lot of fun learning new tricks & meeting new members of our community. I am planning to have one more dashboard contest and I need your help.
I need you to suggest a topic for the contest (optional: and give some sample data)
Just drop a comment with your suggestions (and point to source data if any). We will have a dashboard contest on one of those topics.
Read the rest of this post to get some useful Excel related links.
Continue »Are you a Solver Virgin? Watch this tutorial video …,
Do you ever think about questions like this?
1) What is the maximum profit we can make?
2) What is the best way to schedule employees in shifts?
3) What the best combination of tasks we can finish in a given time?
You might have heard about Excel Solver tool while trying to find solutions to questions above. If you have never used Solver or have little idea about it, then this post and video are for you.
Continue »
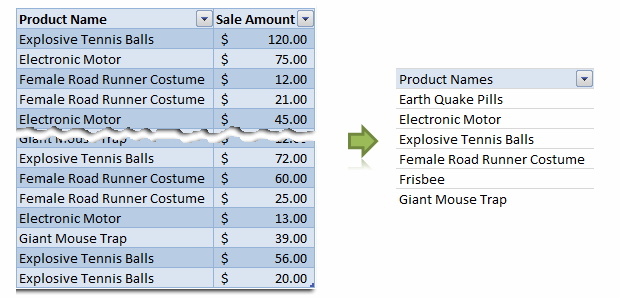
Removing duplicate data is like morning coffee for us, data analysts. Our day must start with it. It is no wonder that I have written extensively about it (here: 1, 2, 3, 4, 5, 6, 7, 8). But today I want to show you a technique I have been using to dynamically extract and sort […]
Continue »How I Analyze Excel School Sales using Pivot Tables [video]
Some of you know that I run an online excel training program called Excel School. If you want to join, click here. Only 8 days left.
I run excel school mainly to meet new students, understand their problems and learn new ways to solve them. But, Excel School also presents me with an interesting analytics challenges. In this post, I will share 2 pivot table based analytic techniques I used just yesterday to answer few questions I had about Excel School sign-ups.
Watch this 15 min. video to see how I analyzed the data
Continue »Data Tables & Monte Carlo Simulations in Excel – A Comprehensive Guide

If anybody asks me what is the best function in excel I am drawn between Sumproduct and Data Tables, Both make handling large amounts of data a breeze, the only thing missing is the Spandex Pants and Red Cape!
How often have you thought of or been asked “I’d like to know what our profit would be for a number of values of an input variable” or “Can I have a graph of Profit vs Cost”
This post is going to detail the use of the Data Table function within Excel, which can help you answer that question and then so so much more.
Continue »Grouping Dates in Pivot Tables

Do you know you can group dates in pivot tables to show the report by week, month or quarter? I have learned this trick while doing analysis on a pivot table today. In this online lesson on pivot tables, I will teach you how to group dates in pivot tables to analyze the data by month, week, quarter or hour of day.
Continue »Chart this Sales Data and get an iPod Touch [Visualization Challenge #2]
![Chart this Sales Data and get an iPod Touch [Visualization Challenge #2]](https://chandoo.org/img/cb/ipod-touch-8gb.png)
Here is a challenge many people face. How to make a chart visualizing sales data with several dimensions like product, brand, region, sales person name, year (or month or quarter) and one or two values like sales, # of units sold, profits, # of new customers.
In visualization challenge #2, all you have to do is a make a chart or dashboard to visualize this sales data effectively.
Continue »Product Recommendation – Excel Lookup Toolbox

Anyone working on the data using excel will know the importance of lookup formulas. They are vital for making almost any spreadsheet or dashboard. That is why when my friend John Franco, who maintains Excel-Spreadsheet-Authors.com, wrote to me about his new book Excel lookup toolbox I was truly excited. In this post I am going to share my review of this product.
Continue »Create a number sequence for each change in a column in excel [Quick Tip]
![Create a number sequence for each change in a column in excel [Quick Tip]](https://chandoo.org/img/n/sequence-number-with-row-change-th.png)
Here is a quick formula trick you can use to generate sequence numbers that only increment when there is a change. Assuming the sequence of values are in column C from C3, you can write the following formula in B4 onwards (B3 will be 1, wake up…) =IF(C4=C3,B3,B3+1) Now just copy paste the formula over […]
Continue »Tweetboards – Alternative to traditional management dashboards
Here is a fun, simple and different alternative to traditional dashboards. Introducing….
One more method to find unique values in excel and you can call me a dork

Use Excel Pivot tables to find and extract unique items in your data. This method is very fast and easily scalable.
Continue »

