
 Why do we make dashboards? To me the reason would be “to provide all the necessary information at a glance so that you can make a decision (or just get a feel)”
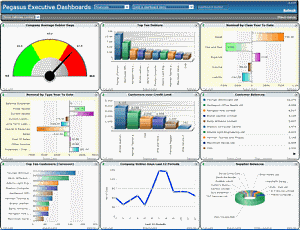
I think the traditional dashboards are overloaded with lots of information (and sometimes data) and often take more time to interpret. This means less time for decision making.
With that backdrop, I would like to propose a simple alternative to executive dashboards
Tweetboard
What in the name of 13 sliced pie chart is a tweetboard?
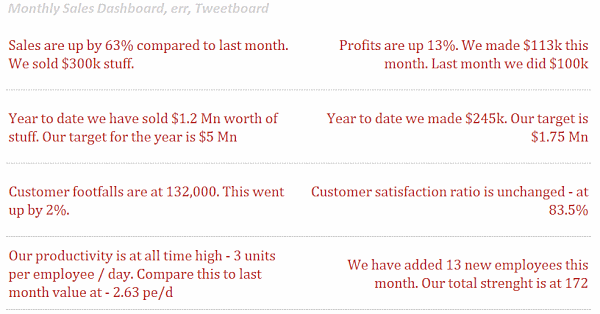
Imagine a dashboard with out charts, but with 6 to 8 sentences, each less than 140 characters, explaining the data / trends concisely. That, my dear bird, is a tweetboard.
Take a look at an example tweetboard of monthly performance and you will know what it is:
Why I think tweetboard is an alternative to dashboard?
Because with tweetboard, your focus will be on reading the sentence and figuring out what to do with your business, not on making sense of 3 bars going up and 2 going down.
How to make a tweetboard?
Simple, Download the tweetboard excel template. Now go process your data, identify the messages you want to show in the dashboard. Go type them in the tweetboard template. Take a deep breath and go tell your story to the world.
Let us discuss:
What do you think? Would you replace a dashboard with tweetboard? Do you think it can stir up a decision maker towards action.
PS: I got the idea of tweetboard while reading Juice’s article on whether dashboards should be limited to one page.
PPS: The dashboard image is from accounting web.
PPPS: This is the first post with 2 3 PSs. 😛


18 Responses
Chandoo, you are offering a template to *put text in columns* in Excel in a specified format. The text also has to come from the user, after analysing his data.
True marketing! 🙂
I would say a dashboard/tweetboard hybrid would do well. 🙂
I like the Tweetboard idea, but I think it would be more effective as a caption to the data viz.
Hi Chandoo,
In general I like the concept – we definitely need something to distill all the information out there into something that is significant enough to act on. In order to avoid the classic blunders often inherent in single point comparisons like “this month vs. last month”, I would propose a statistical filter like SPC to ensure what is being “tweeted” really is relevant (e.g. in your example, productivity being at an “all time high” may or may not be statistically significant since even random data series have a min and a max value).
Wheeler has a great book on this subject:
http://www.spcpress.com/Merchant2/merchant.mvc?Screen=PROD&Store_Code=SPI&Product_Code=53-1&Category_Code=BOOKS
Thanks,
Ben
Hello, Chandoo,
I’m a long-time follower of your weblog, but it’s the first time I post a comment here.
Among all the good advice I’ve received from you, I think this one is the best one so far. I have just two comments:
1. Dashboards usually are dinamically updated. This is mostly related with the fact that we always want to know the same things about our business. Tweetboards, with some string concatenation and formula trickery, should be able to always say the same phrases, with updated info. That, in my opinion, would actually make tweetboards comparable to conventional dashboards.
2. Although I am all excited about tweetboards, a question arises: will senior executives adapt to it? I’m young, have lots of experience with computers, am a twitter user, and so on. A 50yo executive would not reject this idea, because “it’s different from what I’m used to”?
Best regards, and thanks a lot for all your though, inspiring work,
I think this is a good idea and to Joe’s point, I think this is just another way to show the data. Great idea to put into the toolkit of different reporting outputs because I think in some instances, this way of reporting is great!
In the template, what’s the reason being columns D and E? I see a reference to the LENGTH of columns.
While this could provide more info, it does assume that the comments will be read. With the dashboard concept (if not overdone), most readers are focused on 1-2 issues & just look at the relevant chart or charts. That seems much quicker unless the formats are being changed too often.
Interesting idea, but as a replacement for visualisations, I don’t think I like it.
One reason – if you’re doing this regularly, for a daily, weekly or monthly report, then this will add time to the process, whereas a chart can be updated automatically.
Another reason – it relies on the creator selecting the bits of data to talk about, and also relies on them talking about them clearly, accurately and truthfully. Admittedly, charts also allow their creators to manipulate what data is shown and not shown, but in more subtle ways.
Another reason – with a chart or other visualisation, the audience at least has the opportunity to identify features in the data that are significant to them, that the chart’s producer may not have recognised themselves.
If I was presented with a Tweetboard, I think my response would be – “Fine, but show me the chart.”
Sorry but I think the Tweetboard actually means less data than a chart, but much more ink, and I’m guessing Tufte would not like it.
I agree with Gerald; very interesting idea, but…
…it seems that the dashboard definition given implies that visualization is a requirement of a dashboard, since the it reads: “…to provide all the necessary information AT A GLANCE [emphasis added] so that you can make a decision (or just get a feel)”.
The tweetboard doesn’t offer data visualization. Indeed, I think it’s hard to view the tweetboard and get a feel for the data “at a glance”. Rather, I seem to be making an effort to conceptualize the abstract ideas conveyed in the brief messages.
From what I’ve read of Stephen Few, and noting how certain vendors with good dashboard products take into account studies of human cognition, there are reasons why these folks place an importance on visualizations (e.g., graphs) for analysis and not on declarative sentences.
Very good discussion everyone.
I agree that “tweetboards”,
> would be difficult to automatically update
> easy to manipulate and introduce subjectivity
> lessen the amount of data shown to few key terms / trends / numbers
On the other hand “traditional dashboards” often leave the part of finding the story to the reader of the chart. Where as tweetboards leave the story telling to chart creator thus forcing the reader of the chart to agree / do something with the story.
And then there is the aspect of people used to reading 5-10 charts finding tweetboards difficult to adapt. But we are evolving and the way we consume information and make decisions is changing everyday. We no longer go to library or research alot, we google and wikipedia instead. To that extent I imagine a future where decision makers and storytellers using new and exciting methods.
Specific comments:
@Ben: I agree with you. With words one needs to be more careful, where as numbers dont lie.
@Aires: Welcome to commenting. We are fortunate to have long time readers like you in the community.
@Raymon: The column D and E show how many characters are entered. Just so that you know when you are above 140 characters (the standard tweet / sms size)
@Bobbo: Dashboards leave the decision making, story to the interpreter. Tweetboards try to bridge that gap.
I already do something like this. I have a bunch of data that I create a table of results from. I then graph the data but also pick out the interesting items that I know the client will be interested in and show that in text.
It’s a dynamic table so I just dump my data in to it once a month and Bob’s your Mums live in lover. Or whatever…..
Mail me if you’d like to see it. It’s not rocket science though, I’ll admit! 🙂
@Lee: That is fantastic to know. Can you send me the file or upload it to skydrive or something?
Yeah, here’s a copy
http://cid-de4323d2d573c31f.skydrive.live.com/browse.aspx/.Documents
Lee
@Lee, awesome stuff… thanks 🙂
What is the big deal about this. I have been doing this since I started working professionally. Doing an executive summary via bullet points (that is all this is) I bet has been done for hundreds of years.
Secondly, doing this along side your charts, again your point. I think it is piss poor communication to not do this at an executive level. I would get ripped apart if I did not put in writing a brief explanation of my numbers I have in a chart. Now I might need to explain them in more detail verbally in the meeting. However, they are the major points or explanations on why a number is what it is. The charts only help show my explanation is correct, and give people information to ask other questions to see if my answers jive, if they are already in the charts, or if I need to research the question.
Now if you could use some statical rules to create these explanations automatically, that would rock. However, I think that would be a headache to create due to the amount of variances of types of explications. I think there would be way to many cases were one would need to override the automatically created explanations.
Overall I think it is a good point to bring up if you have never seen this before.