All articles with 'advanced excel' Tag
Looking up when the data won’t co-operate (case study)
Occasionally we deal with data that is so uncooperative that we might as well give up and go back to calculators & ledger books.
Recently I found myself in such a situation and learned something new.
Introducing … data that won’t play nice
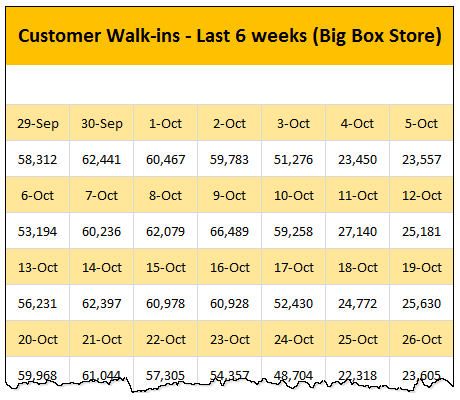
Drum roll please. Here is a data-set that I got from somewhere.
The problem – build a lookup formula
And the problem. Oh, simple. Write a lookup formula to find how many customer walk-ins we have on any given day.
But how?
Continue »The ultimate VLOOKUP trick – Multi-condition Lookup
This is a guest post by Sohail Anwar.
Let’s not bore you with an intro. You are about to learn a VLOOKUP trick that Lucifer himself would not want you to know. It’s so absurdly powerful that it was developed in a lab and had to be tested on Rocky’s arch nemesis Ivan Drago.
Presenting the Multiple criteria VLOOKUP!
…boring…pass, we’ve seen it.
Oh, have you? Not like this you haven’t. This will change the way you work with Excel.
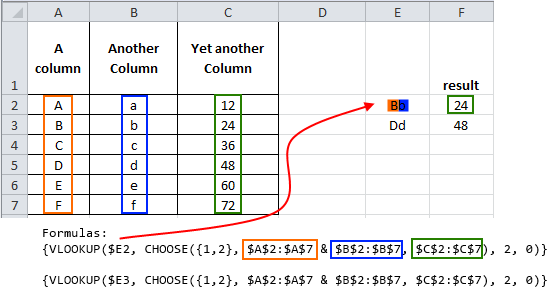
Let me start with an easy example. Here’s some data and we would love to know what Bb and Dd is.
Continue »ABC Inventory Analysis using Excel
ABC analysis is a popular technique to understand and categorize inventories. Imagine you are handling inventory at a plant that manufactures high-end super expensive cars. Each car requires several parts (4,693 to be exact) to assemble. Some of these parts are very costly (say few thousand dollars per part), while others are cheap (50 cents per part). So how do you make sure that your inventory tracking efforts are optimized so that you waste less time on 50 cent parts & spend more time on costly ones?
This is where ABC analysis helps.
We group the parts in to 3 classes.
- Class A: High cost items. Very tight control & tracking.
- Class B: Medium cost items. Tight control & moderate tracking.
- Class C: Low cost items. No or little control & tracking.
Given a list of items (part numbers, unit costs & number of units needed for assembly), how do we automatically figure which class each item belongs to?
And how do we generate above ABC analysis chart from it?
Continue »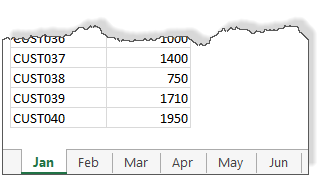
We all know about the MAX formula. But do you know about 3D Max?
Sounds intriguing? Read on.
Lets say you are the sales analyst at ACME Inc. Your job involves drinking copious amounts of coffee, creating awesome reports & helping ACME Inc. beat competition.
For one of the reports, you need to find out the maximum transactions by any customer across months.
But there is a twist in the story.
Your data is not in one sheet. It is in multiple sheets, one per month.
Continue »Mapping relationships between people using interactive network chart

Today, lets learn how to create an interesting chart. This, called as network chart helps us visualize relationships between various people.
Demo of interactive network chart in Excel
First take a look at what we are trying to build.
Looks interesting? Then read on to learn how to create this.
Continue »This is a guest post by Krishna, a football lover & one of our readers.
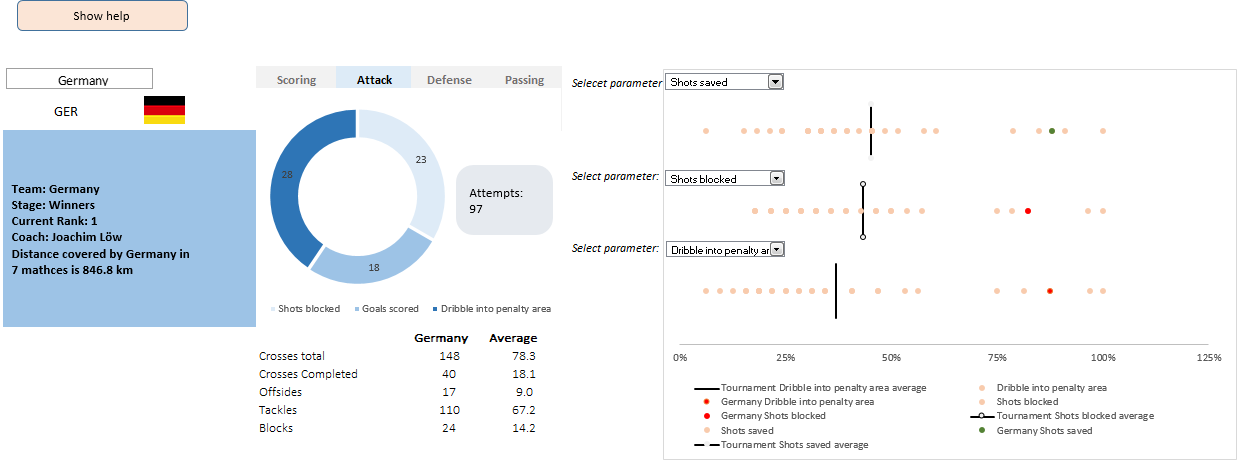
The wait for lifting the most valued priced in football for Germans was finally over. For a football fan, world cup is best time that is scheduled every four years and that if your favorite team lifting the trophy is like your crush is going on a date with you. 🙂
A sneak-peek at the final dashboard
Here is the final dashboard (it has more functionality than depicted). Click on it to enlarge.
Continue »How fireworks animated chart is made [video tutorial]
On July 4th this year, I published an animated fireworks chart for you. Many of you liked it. Quite a few wanted to know how its made.
So here is a video explaining the construction of fireworks.
(You can see this video on our YouTube Channel too)
Continue »CP014: How to create awesome dashboards – 10 step process for you
Podcast: Play in new window | Download
Subscribe: Apple Podcasts | Spotify | RSS
In the 14th session of Chandoo.org podcast, lets figure out how to make awesome dashboards.
What is in this session?
Excel based dashboards are much in demand these days, thanks to advancements in Excel & growing pressure on costs. Now a days, analysts & managers are expected to quickly put together a dashboard using Excel. But how do you make a dashboard? What process you should follow? These are the questions we address in this podcast.
In this podcast, you will learn,
- Announcements about upcoming dashboard classes
- Ten step process for creating awesome dashboards
- 1. Talk to your end users
- 2. Make a sketch of the dashboard
- 3. Validate your understanding
- 4. Collect data
- 5. Structure the data
- …
Hello everyone. Stop reading further and go fetch your helmet. Because what lies ahead is mind-blowingly awesome.
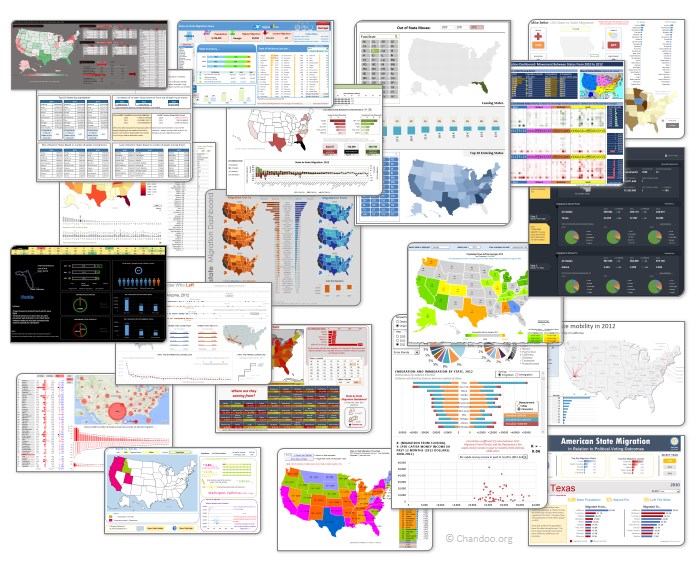
About a month and half ago, we held our annual dashboard contest. This time the theme is to visualize state to state migration in USA. You can find the contest data-set & details here.
We received 49 outstanding entries for this. Most of the entries are truly inspiring. They are loaded with powerful analysis, stunning visualizations, amazing display of Excel skill and design finesse. It took me almost 2 weeks to process the results and present them here.
Click on the image to see the entries.
Continue »Building a simple timer using Excel VBA to track my Rubik’s cube solving speed [case study]
![Building a simple timer using Excel VBA to track my Rubik’s cube solving speed [case study]](https://img.chandoo.org/vba/excel-timer-demo.gif)
Today, lets learn how to make a simple timer app using Excel. First some background…,
Recently, I learned how to solve Rubik’s cube from my nephew. As a budding cuber, I wanted to track my progress. Initially I used the stopwatch in my iPhone. But it wont let me track previous times. So I thought, “Well, I can use Excel for this”.
So I made a small timer app using Excel. Its quite minimalistic. It has a single button. I press it and it tracks the start time (date & time stamp). If I press the button again, it records the duration.
This way, I can see my progress over next few weeks and may be plot the trend.
Continue »CP005: Introduction to Form Controls – an interview with Debra Dalgleish
Podcast: Play in new window | Download
Subscribe: Apple Podcasts | Spotify | RSS
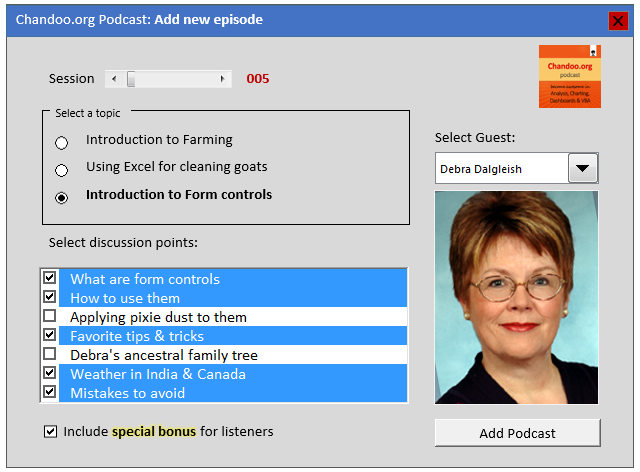
In the 5th session of Chandoo.org podcast, we are going to demystify form controls.
I am very happy and excited to interview my good friend, fellow Excel MVP, author, blogger and virtual mentor – Debra Dalgleish about this topic.
In this podcast, you will learn,
- What are form controls
- When you would use them?
- Example form control – Combo box
- How form controls differ from active-x controls
- How to enable form controls in your Excel?
- Various important form controls
- Special bonus & how to obtain it
CP003: Business Intelligence for Masses – Interview with Mike Alexander

Podcast: Play in new window | Download
Subscribe: Apple Podcasts | Spotify | RSS
In the third session of Chandoo.org podcast, we are going to get BI curious. 😉
Not that kind you silly, We are talking about Business Intelligence, Big Data, Power Pivot & other Power BI family members. In this session, I am happy to feature Mike Alexander – Microsoft MVP, Author, Blogger & a good friend. Mike talks about how Excel is shaping the BI (Business Intelligence) revolution with advent of Power BI functionality.
You will learn,
- Introduction, what Mike is up to these days?
- What is BI, what does it mean to an average Excel analyst?
- What BI capabilities Excel has – brief intro to each of them
- Power Pivot & what it does
- Power Query & why it is important
- Power View & how it works (and where it sucks)
- Power Maps
- How to learn about these new technologies
- Recommended Books
- Websites
- Courses
- Live classes
- Special gift for our listeners
Calculate maximum change [homework]
![Calculate maximum change [homework]](https://chandoo.org/wp/wp-content/uploads/2014/03/fc-calculate-max-change.png)
Today, lets see how good your formula skills are.
Calculate maximum change
Can you calculate what is the maximum change in product sales between 2 months for above data?
Continue »Handle Volatile Functions like they are dynamite

If you’re building large models, then you may want to use volatile functions – including OFFSET(), INDIRECT(), and TODAY() – with caution, because unless you know what you are doing, they *might* slow Excel down to the point that data entry is sluggish, if not downright tedious.
In fact, you *might* want to consider getting out of the habit of using these functions at all if there are alternatives, and you might want to replace volatile functions in your existing models with non-volatile alternatives…I have reduced recalculation time in large models from minutes to milliseconds by doing just that!
So what the heck does volatile actually mean? And why should you care? Let’s find out, shall we?
Continue »Robust Dynamic (Cascading) Dropdowns Without VBA
Recently I posted about how you could construct dynamic (cascading) dropdowns that could easily handle multiple levels, like this: …and we saw that users could subsequently change upstream dropdowns in a way that would make downstream choices invalid, like this: In my previous post I used some VBA to clear out any ‘downstream’ choices if […]
Continue »
