Excel Charts, Graphs and Templates
Tutorials, Examples and explanations on Excel charting. You can learn how to create almost any chart type in this section. Also learn how to create effective charts, make them interactive and add automation thru VBA
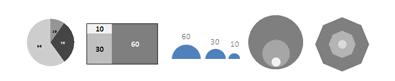
RSS Icon using Donut Charts – Because it is Weekend |
|
|
|
RSS Icon using Donut Charts – Because it is Weekend |
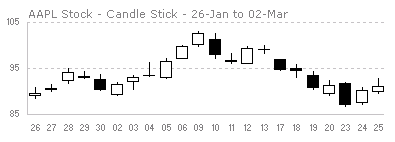
Japanese Candlestick Chart – Excel Tutorial |
|
|
Japanese Candlestick Chart or Candlestick Chart as they are popularly known are one of the most commonly used stock charts.Today we will learn how to make a candlestick chart in Microsoft Excel in 4 simple steps. |
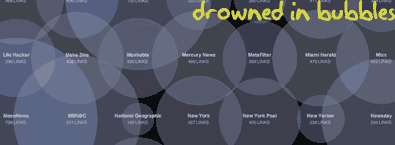
How Many Bubbles are Too Many Bubbles? |
|
|
In How Many Links are Too Many Links, O’Reilly radar shows us this unfortunate bubble chart. Read the rest to see why the chart is unfortunate. |
What is Your Opinion on Pie Charts? |
|
|
Pie charts are one of the most used charts in the world. And for obvious reasons: they are simple to create and easy to understand. When it comes to pie chart, I have no clear opinion. Part of me says use them, the other says avoid them. What is your opinion on Pie charts ? |
Welcome Robert & ClearlyAndSimply.com to Blogging |
|
|
Remember Robert, he is the author of the popular KPI Dashboard Series of posts on this blog. Now there is good news, he started a blog and writes about information dashboards, data visualization. |
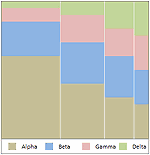
Market Segmentation Charts using Conditional Formatting |
|
|
Trust Peltier to come up with solutions for even the most impossible looking charts. Today he shares a marimekko chart tutorial. I couldn’t sit still after seeing his post. So here comes market segmentation charts or marimekko charts using, |
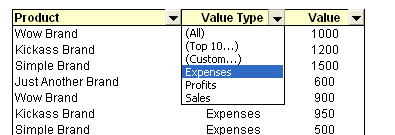
Make a Dynamic Chart using Data Filters |
|
|
As part of our spreadcheats series, we will learn how you can use data filters to create dynamic charts in Microsoft excel |
Review of PTS Clustered Stack Chart |
|

|
My Friend and long time Microsoft Excel MVP, Jon Peltier has released a wonderful little excel charting utility called Cluster Stack Chart Utility. Out of curiosity I have mailed Jon and asked him if he could send me a copy of it so that I can review the product and recommend it to PHD reader community. He is kind enough to mail the add-in to me and here goes my review of the tool. |
Professional Resume or Data Visualization Fail? [poll] |
|
![Professional Resume or Data Visualization Fail? [poll]](https://chandoo.org/img/c/data-visualization-resume.png)
|
Michael Anderson, a web designer has posted this delicious looking visual resume. While the resume looks stunning at a glance, a closer inspection reveals that you cant really make any valuable conclusions about Michael’s past experience and qualifications. Of course if the purpose of this resume is to show that he is a fabulous designer, then the resume definitely achieved that. |
[Weekend Poll] How do you Sex up your Charts? |
|
![[Weekend Poll] How do you Sex up your Charts?](https://chandoo.org/img/a/your-fav-chart-format.png)
|
This weekend, let us talk … umm… charts. I want to know if you absolutely make sure your charts look good every time you sent them out to someone. I do this most of the time. How do you sex up your charts? |
Colors in Chart Labels [Quick Tip] |
|
![Colors in Chart Labels [Quick Tip]](https://chandoo.org/img/a/chart-label-formatting-trick.png)
|
A simple label formatting hack can improve the effectiveness of YoY change charts by adding color to differentiate positive vs. negative growth (or mediocre vs. sky rocketing growth rates). See this example: |
100 Excel Tips & Resources |
|
|
|
Hurray, PHD blog crossed 2000 RSS Subscriber base. This is a very significant milestone for me. To celebrate this occasion we have a mega post: 100 Excel & Charting Tips, Tricks and Resources for you. |
Do you know how to KISS, Wall Street Journal Does! |
|

|
Do you know the “KISS” principle of chart design ? |
[Reader Poll] Stacked, Seperated or Mirrored ? |
|
![[Reader Poll] Stacked, Seperated or Mirrored ?](https://chandoo.org/img/a/bar-charts-ways-to-stack.gif)
|
Stacked bar charts are a popular way to depict 2 more series of related data, like sales of 2 products.But there are several ways to stack the bars in a bar chart. Here is a list of 6 ways to stack them |
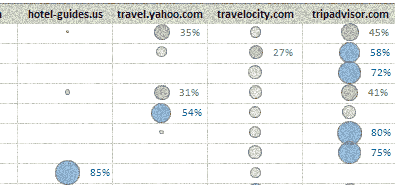
Visualizing Search Terms on Travel Sites – Excel Dashboard |
|
|
Microsoft excel bubble chart based Visualization to understand how various travel sites compete search terms |
Why No One Likes Your Pie Charts (And What to Do About It) |
|
|
9 charting tricks you can use to make your pie charts likable |
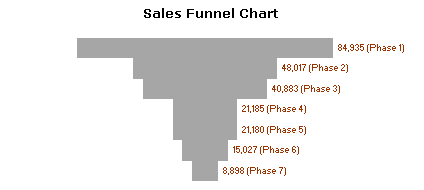
Sales Funnel Charts in Excel – Tutorial |
|
|
Sales funnel is a very common business chart. Here is a simple bar chart based trick you can use to generate a good funnel chart to be included in that project report. |
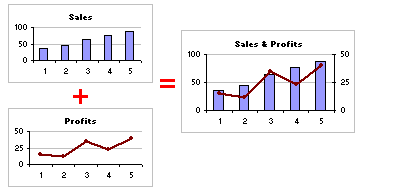
Excel Basics – What are Combination Charts and How to Make One? |
|
|
A combination chart is when you combine two different charts to make one. A popular example for combination chart is a line & bar graph combination. |
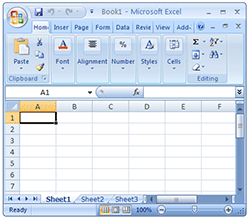
Excel 2007 Review – 10 things that WOWed me |
|
|
After a really long wait finally I have used … Excel 2007 (drum roll) and contrary to what many people think, I have found Excel 2007 to be a very well designed piece of software. Of course there are various issues with it and I am sure folks at MS are working on them so that next versions of MS Office are much more pleasant and simpler to use. I wanted to share 10 wow factors in Excel 2007 that may convince you to try it. |
Creating Excel Art from Images [spreadsheet fun] |
|
![Creating Excel Art from Images [spreadsheet fun]](https://chandoo.org/wp/wp-content/uploads/2008/12/cell-art-image-thumb.png)
|
Amit at Digital Inspiration features a lengthy way of creating beautiful excel cell art from an image. I guess we all can use a method that is little simpler and smarter. |

