Archive for June, 2014
CP012: Top 10 Excel Keyboard Shortcuts for you

Podcast: Play in new window | Download
Subscribe: Apple Podcasts | Spotify | RSS
In the 12th session of Chandoo.org podcast, lets get productive fast.
Announcement: Short format podcasts sessions once a month
Based on listener feedback, I am adding short format sessions (20 mins). This short format sessions will run once a month (along with longer sessions that we publish almost every week) so that you have something light & easy to chew between heavy doses of Excel awesomeness.
I hope you like this new format. Do let me know what you think in comments.
And I really appreciate your reviews & comments on iTunes. Please click here and post your review.
Continue »Is this a FIFA worldcup of late goals? Lets ask Excel

Just like millions of viewers around the world, I too have been spending hours watching FIFA world cup football matches on TV. I don’t like spending hours watching TV. But when its FIFA world-cup time (which is once every 4 years), I am glued to the idiot box. Blame it on PaWaRa, my school teacher in 8th grade who instilled this passion.
So while watching the match day before yesterday (it was Holland vs. Chile), the commentator said, “This has been a world-cup of late goals” as both teams maintained 0-0 until 77 minute mark when Leroy Fer scored a goal for Holland.
That got me thinking,
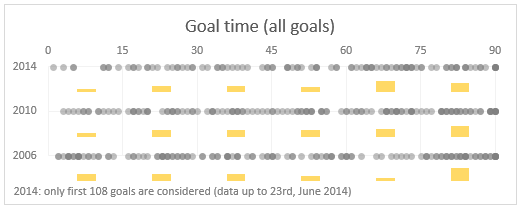
Is this really a world-cup of late goals?
But I quickly brushed away the thought to focus on the match.
Later yesterday, I went looking and downloaded all the goal data for 2006, 2010 & 2014 FIFA world-cup matches (2014 data for first 36 matches).
Lets examine the hypothesis “2014 has been a world-cup of late goals”.
Continue »Vote for your favorite US state migration dashboard
They are here! the shortlisted 12 entries of our dashboard contest for 2014 are here.
Please take a minute to review the entries and cast your vote. Click here.
Go ahead and cast your vote. Online voting for your favorite entries closes at midnight on 25th June, Wednesday (2014), Pacific time.
Continue »CP011: 5 Excel magic tricks to impress your boss

Podcast: Play in new window | Download
Subscribe: Apple Podcasts | Spotify | RSS
If you want to create magical effect with your Excel workbook (or report, dashboard, model), then hear no further. In this episode, we explore 5 very powerful magic tricks you can apply to get jaw dropping reactions from your bosses, clients & colleagues.
In this podcast, you will learn,
- Annoucements
- Why magic
- 5 Excel Magic Tricks
- 1: Conditional formatting
- 2: Form controls + Charts
- 3: Pivot tables + Slicers
- 4: Macros + Automation
- 5: Using right feature @ right time
- How to learn these magic tricks
- Conclusions
Top 10 things we struggle to do in Excel & awesome remedies for them

Recently we asked you, what do you struggle doing in Excel? 170 people responded to this survey and shared their struggles. In this post, lets examine the top 10 struggles according to you and awesome remedies for them.
Continue »Hello everyone. Stop reading further and go fetch your helmet. Because what lies ahead is mind-blowingly awesome.
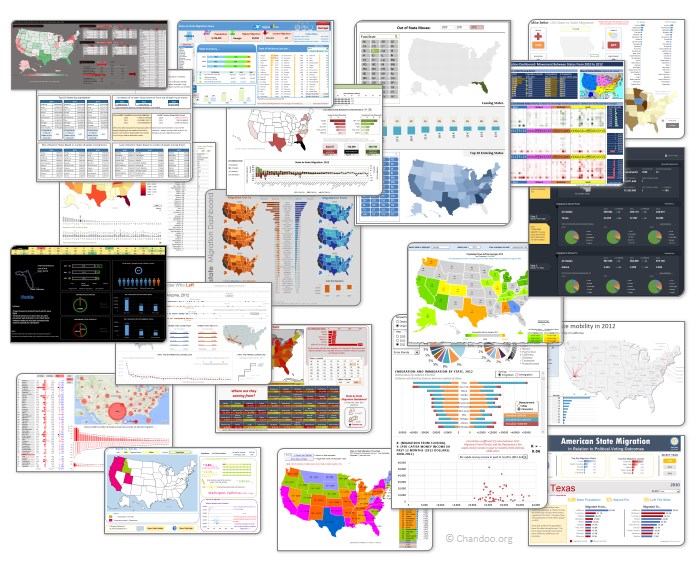
About a month and half ago, we held our annual dashboard contest. This time the theme is to visualize state to state migration in USA. You can find the contest data-set & details here.
We received 49 outstanding entries for this. Most of the entries are truly inspiring. They are loaded with powerful analysis, stunning visualizations, amazing display of Excel skill and design finesse. It took me almost 2 weeks to process the results and present them here.
Click on the image to see the entries.
Continue »Matching transactions using pivot tables [video]
Last week, we learned how to use formulas to reconcile (match) transactions in Excel. Today, lets take a look at even faster and simpler way to do this:
Using Pivot Tables
Here is a short video explaining the technique and why it works. See it below
Continue »Matching transactions using formulas [Accounting]
![Matching transactions using formulas [Accounting]](https://img.chandoo.org/f/example-of-matching-transactions.png)
Imagine you are the head of Accounts Receivable department at a large company. Drab, I know, But humor me and imagine.
Now, every month you get a transaction report.
And you want to know which numbers are matching up.
i.e, if your company gave Vendor-0002 $872.34 on 1st of April, 2014 and your received below payments from them subsequently,
- $427.77 on 1st April
- $152.88 on 2nd April
- $291.69 on 2nd April
Then you consider the account matched since the total received is same as total payable.(427.77 + 152.88 + 291.69 = 872.34).
Continue »


