All articles with 'screencasts' Tag
{ 27 Comments }
Insert Multiple Columns at once [Quick tip]
Published on Jan 15, 2013 in Excel Howtos
![Insert Multiple Columns at once [Quick tip]](https://img.chandoo.org/q/insert-multiple-columns-excel-tip.gif)
Here is a quick tip to start your week. Ever wanted to insert a few columns in between like this? Here is how to do it. Hold down control key. Select one column at a time Right click and choose Insert Done! Bonus tip: You can use this to insert rows too! More Quick tips.
Continue »{ 63 Comments }
To-do List with Priorities using Excel
Published on Jan 7, 2013 in Excel Howtos, Templates
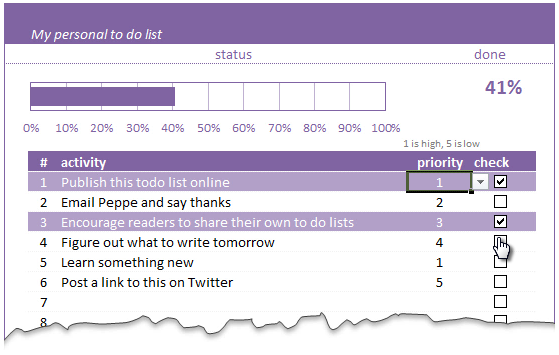
A while ago, we published a new year resolution template. This was a hit with our reader with thousands of you downloading it. During last week, Peppe, one of our readers from Italy, took this template and made it even more awesome.
The original template had tasks and completion check mark. As you finish each task, you can see the progress bar moving.
Peppe added priorities to this. With his new version, progress is measured based on how much priority we assigned that particular task. Pretty neat eh?!?
Continue »{ 33 Comments }
Monitoring Monthly Service Levels using Excel Charts [Example]
Published on Dec 20, 2012 in Charts and Graphs
![Monitoring Monthly Service Levels using Excel Charts [Example]](https://img.chandoo.org/c/service-levels-7-years-excel-chart.png)
Recently, I wrote a tutorial on tax burden in USA chart.
Jared, One of our readers liked this chart very much. Jared works as a workforce scheduler and has data similar to our chart. So he applied the same technique to analyze monthly service levels for last 7 years & sent me the file so that I can share it with all of you.
First take a look at the demo of Jared’s chart. And read on to know how this works.
Continue »
Rama, one of our readers emailed this:
I Have Many List boxes In That I need to Hide Few Of them Using Check box
Show Hide list boxes by using a check box
We can use check box and a bit of VBA to do this easily. Something like above demo.
Read on to learn how to do this using Excel & VBA.
Continue »{ 126 Comments }
Extract data using Advanced Filter and VBA
Published on Nov 27, 2012 in Excel Howtos, VBA Macros

In this post we will learn how to use the Advanced Filter option using VBA to allow us to filter our data on a separate sheet. This has been requested by a lot of our readers and here is how we will use them.
Continue »{ 8 Comments }
Happy Diwali [Animated Chart inside]
Published on Nov 13, 2012 in Charts and Graphs, VBA Macros
![Happy Diwali [Animated Chart inside]](https://img.chandoo.org/c/animated-diwali-chart-in-excel.png)
My heartiest Diwali wishes to all our readers.
The spirit of Diwali is to encourage people to spread joy, celebrate good things and throw away darkness (evil). These ideas are universal. So let me wish you a very happy Diwali.
Diwali, festival of lights, is celebrated in the month of October / November. It is one of my favorite festivals since childhood. A time when all family members get together, celebrate all the good in their life, laugh and light a few fire crackers (fire works).
This year, our kids (Nishanth & Nakshatra) too are excited about the festival. They are eager to light diyas (small lamps), watch the fire works and enjoy. Naturally I do not feel like opening Excel.
But then…,
Sometime during my morning coffee, I thought “hey, why not create a small Diwali greeting using Excel?”
So here we go.
Continue »{ 54 Comments }
Show monthly values & % changes in one pivot table
Published on Nov 6, 2012 in Excel Howtos, Pivot Tables & Charts
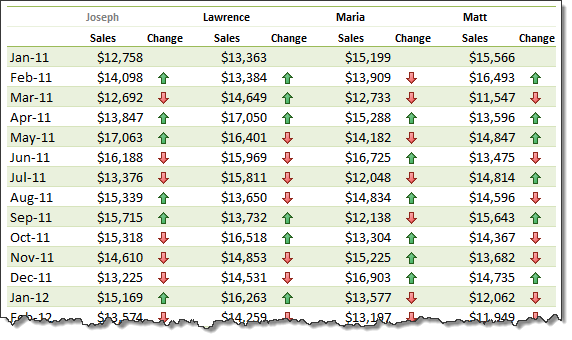
Pivot tables are great help when analyzing lots of data. One of the common questions managers & analysts ask (when looking at monthly sales data for example) is,
How is the monthly performance of our teams (or regions, products etc.)?
A pivot report can answer this question in a snap. Today lets learn how to do that.
Continue »{ 45 Comments }
Journey of Hurricane Sandy – Animated Excel Chart
Published on Oct 31, 2012 in Charts and Graphs, VBA Macros
Hurricane Sandy has taken front seat in all major news channels, papers, websites even in far off places like India. I hope & pray that our readers in US East coast are safe.
Today, lets understand the journey of Hurricane Sandy in this animated chart, prepared by Chris from Excel365.
Continue »{ 10 Comments }
Even faster ways to Extract file name from path [quick tip]
Published on Oct 24, 2012 in Excel Howtos, VBA Macros
![Even faster ways to Extract file name from path [quick tip]](https://img.chandoo.org/f/extract-by-find-replace-demo.gif)
The best thing about Excel is that you can do the same thing in several ways. Our yesterdays problem – Extracting file name from full path is no different. There are many different ways to do it, apart from writing a formula. Learn these techniques to be a data extraction ninja.
1. Using find replace
2. Using text to columns
3. Using UDFs
{ 53 Comments }
Extract file name from full path using formulas
Published on Oct 23, 2012 in Excel Howtos, Formula Forensics
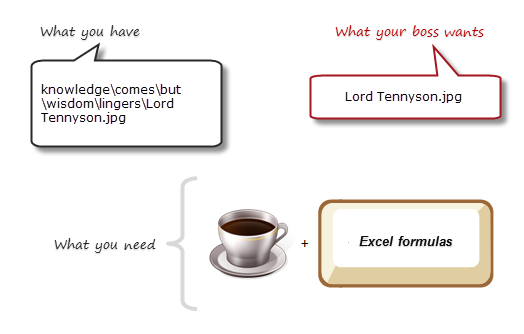
Today lets tackle a very familiar problem. You have a bunch of very long, complicated file names & paths. Your boss wants a list of files extracted from these paths, like below:
Of course nothing is impossible. You just need correct ingredients. I cannot help you with a strong cup of coffee, so go and get it. I will wait…
Back already? well, lets start the formula magic then.
Continue »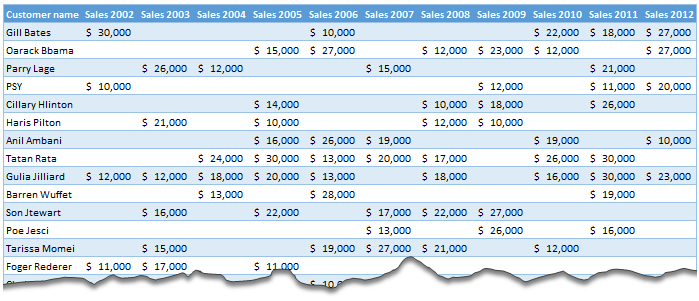
Moosa, one of our readers emailed this interesting question:
I have huge list of customers (around 1500).
Table includes following information
Customer # , Customer Name, Sales 2002, sales 2003, … sales 2012My requirements are
1. list of customer who did not have sales during all these years
2. List of customer who have not business from 2003
3. List of customer who have not business from 2004
Today, lets learn how to identify all the non-performing customers.
Continue »
Today, lets learn OFFSET formula.
OFFSET formula gives us reference to a range, from a given starting point with given height and width in cells.
OFFSET formula syntax
OFFSET formula looks like this:
=OFFSET(starting point, rows to move, columns to move, height, width)
Starting point: This is a cell or range from which you want to offset
Rows & columns to move: How many rows & columns you want to move the starting point. Both of these can be positive, negative or zero. More on this below.
Height & width: This is the size of range you want to return. For ex. 4,3 would give you a range with 4 cells tall & 3 cells wide.
Read on…,
Continue »
Can we make a calendar using Pivot Tables?!? Of course we can. Today let us learn a simple technique to create calendar style reports using Pivot tables. Thanks to Rob for inspiration Before making any progress, let me thank Rob from PowerPivotPro for the inspiration. Recently he wrote an article explaining how to use PowerPivot […]
Continue »![Show Decimal Points if needed [Quick Tip]](https://img.chandoo.org/q/general-formatting-in-excel.png)
Sometimes you want to turnoff decimal points if the value after point is 0. Mireya, Chandoo.org member had one such situation. She writes:
I am a complete beginner in excel, how can I keep the zeros when I am working with decimals and remove them when are not required.
This is where we can use General formatting. Read on to learn how General formatting works and what to do in extreme cases.
Continue »{ 30 Comments }
Growing a Money Mustache using Excel [for fun]
Published on Aug 22, 2012 in Charts and Graphs, Learn Excel
![Growing a Money Mustache using Excel [for fun]](https://img.chandoo.org/trackers/growing-mustache-demo.gif)
Mustache and Excel?!? Sounds as unlikely as 3D pie charts & Peltier. But I have a story to tell. So grab a cup of coffee and follow me.
Today, lets talk about how to construct a dynamic chart that can show us how much progress we have made against a financial goal (in this case, accumulating a big chunk of money). I call this growing mustache chart, inspired from the wonderful Mr. Money Mustache.
Continue »
