All articles with 'powerpivot' Tag
Hi there,
I have a question and an announcement for you.
Question: Are you interested in learning Power Pivot? Do you want to connect, analyze and visualize lots of data using Excel?
IF(Your_answer="YES", "Read Announcement", "Read Announcement anyway!")
Announcement: 2nd Batch of Power Pivot coming on August 1st.
Continue »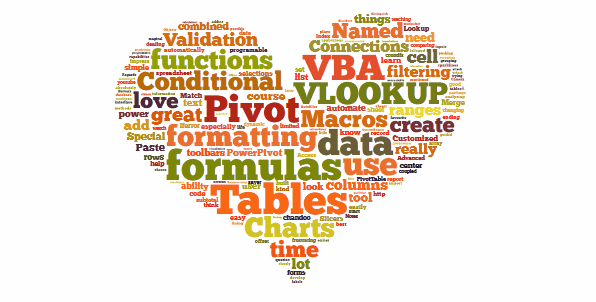
Last week, we had a lovely poll on what are your favorite features of Excel? More than 120 people responded to it with various answers. So I did what any data analyst worth his salt would do,
I analyzed the data and here are the top 10 features in Excel according to you.
Read on to learn more.
Continue »{ 48 Comments }
10 things that wowed me in Excel 2013
Published on Apr 3, 2013 in Charts and Graphs, Learn Excel
As you may new, the newest version of Excel is out for a while. I have been using it since last 6 months and enjoying it. Today, lets understand 10 things in 2013 that wowed me (and probably you too).
Continue »{ 15 Comments }
Finding Conversion ratio using Pivot Table Calculated Items
Published on Mar 6, 2013 in Pivot Tables & Charts, Power Pivot
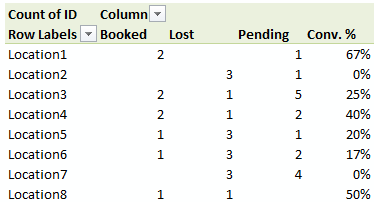
Today, lets understand how to use Calculated items feature in Pivot tables. We will use a practical problem many of us face to learn this feature – ie calculating conversion ratio from a list of sales calls.
Continue »{ 4 Comments }
Last day for enrollments – Join our Power Pivot course & become awesome analyst
Published on Feb 15, 2013 in Power Pivot, products
 Hi folks,
I have a quick announcement & an awesome Power Pivot technique to share with you. First the announcement.
Only few hours left to join our Power Pivot course…
As you may know, I have opened enrollments for our inaugural batch of Power Pivot course few days ago. The aim of this course is to make you awesome in Excel, Advanced Excel, Dashboards & Power Pivot.
We will be closing the doors of this program at midnight, today (11:59 PM, Pacific time, Friday, 15th of February).
If you want to join us, click here and enroll now.
How many people have joined the class?
At the time of writing this, we have 195 students enrolled in Power Pivot class. We are eager to share Power Pivot knowledge & techniques to as many more of you as possible. So go ahead and join us because you want to be awesome in Excel & Power Pivot.
Continue »{ 4 Comments }
Distinct Count & Blanks – Power Pivot Real Life Example
Published on Feb 11, 2013 in Power Pivot
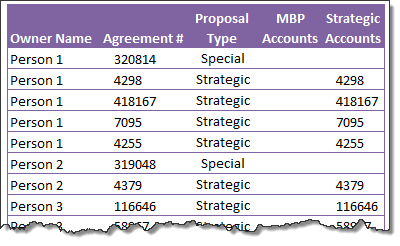
When it comes to analyzing business data, managers are always asking, “so how many distinct x each y is doing?”
And that sends us, data analysts & reporting professionals running from pillar to post figuring out the best way to do it.
- We can use variations of SUMPRODUCT, COUNTIFS etc, but the methods are not flexible..
- We can use VBA, but it would become slow as you add more data.
- We can use Pivot tables, but it only gives half of what we want ie each y part, but not distinct count of x.
- We might as well shave our head with a shovel before manually counting values.
And that brings us to 2 distinctly simple solutions:
- Using Power Pivot & Excel 2010
- Using regular pivot tables in Excel 2013
Today, lets talk about these 2 approaches & see why they are so better than anything else for distinct count situations.
Continue »{ 4 Comments }
Power Pivot & Advanced Excel course is open, Join us today!
Published on Feb 6, 2013 in Power Pivot, products

Hello readers & supporters of Chandoo.org,
I am very glad to announce that our newest online class – Power Pivot course is now open for your consideration. In this post, you can understand details about this course & how to join us.
Click here if you are ready to join us. Read below to learn more.
What is Power Pivot course?
These days almost any job requires data analysis & presentation of results. While anyone can put a list of values in Excel & sum them up, not everyone can do advanced analysis, create charts, make them interactive, summarize data intelligently, present output in an intuitive dashboard or slice & dice data using Pivot tables & Power Pivot. Having these vital skills can make you invaluable to your organization & expose you to new opportunities. Not to mention the amount of time, money & effort you can save by efficiently using Excel.
That is why I have created 2 powerful courses – Excel School & Power Pivot Class. Think of these as steps in a ladder.
Continue »{ 4 Comments }
Details about our Power Pivot Course [and a video for those of you not interested]
Published on Jan 30, 2013 in Excel Howtos, Power Pivot
![Details about our Power Pivot Course [and a video for those of you not interested]](https://img.chandoo.org/power-pivot/power-pivot-course-details.png)
Hello folks,
If this article was a person, they would be schizophrenic. You see, it has 2 purposes:
- Give you all the details about my upcoming Power Pivot course
- Give you a solution to last week’s vacation days problem
Details about Power Pivot Course
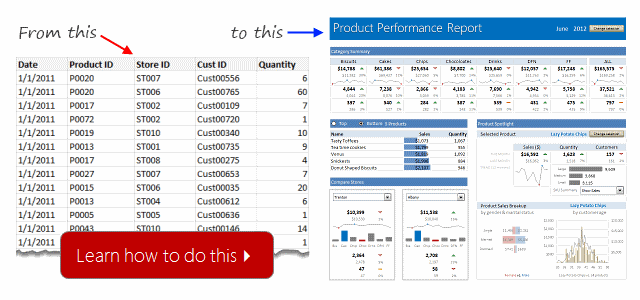
Power Pivot, an Excel add-in makes it easy to connect, analyze & visualize massive amounts of data. This course aims to teach you how to use Power Pivot to analyze data, create advanced reports & prepare dashboards all from familiar interface of Excel. This is ideal for data analysts, reporting & MIS professionals, business analysts, managers & dashboard makers.
{ 23 Comments }
Introduction to DAX Formulas & Measures for Power Pivot
Published on Jan 28, 2013 in Power Pivot
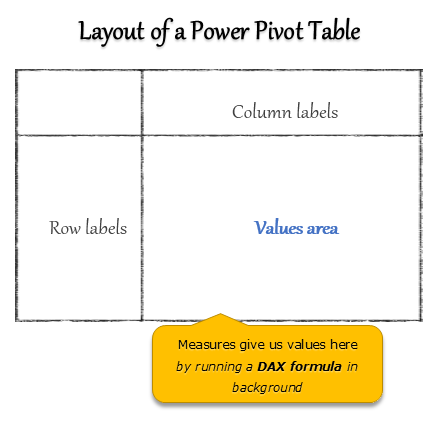
A measure is a formula for the values area of Power Pivot table.
A measure can be implicit or explicit.
Implicit measures are created automatically when you drag and drop a field in to Power Pivot values area. For example, in last week’s introduction, we created an implicit measure for SUM of Sales by dragging and dropping the sales amount field in to values area of our power pivot table.
Explicit measures are created by you using New measure button in Power Pivot tab (or Calculated Field button in Excel 2013 Power Pivot tab). You can also create a measure in the Power Pivot window.
Learn what measures are, how to create them using DAX (Data Analysis Expression) formulas in this video tutorial.
Continue »{ 61 Comments }
What is Power Pivot – an Introduction [video]
Published on Jan 21, 2013 in Learn Excel, Power Pivot
![What is Power Pivot – an Introduction [video]](https://img.chandoo.org/power-pivot/introduction-to-power-pivot-excel.png)
Today, lets talk about Power Pivot & understand it.
What is Power Pivot?
Power Pivot is an Excel add-in to connect, analyze & visualize massive amounts of data..
Lets take a closer look at the definition.
Connect: You can use multiple tables of data & set up relationships between them using Power Pivot. For example, you can connect customer details to sales transactions so that you can summarize sales by customer location or gender easily.
Analyze: You can create simple pivot table style reports or create something exceedingly complex by defining your own calculated fields for values area of the pivot. There is a whole set of formulas defined for exactly this purpose, called as DAX formulas.
Visualize: Instantly filter your reports using slicers, time lines (Excel 2013 or above only), conditional formats, pivot charts etc. You can even define KPIs and see the performance in bands.
Massive Amounts of Data: Although your typical Excel worksheet contains a million rows, if you tried to load even half of those with any data, Excel would quickly become slow & lazy. Power Pivot can take a million rows for breakfast and would be hungry for more. It can processes millions of rows of data very quickly and easily, all from the comfort of a standard desktop or laptop.
Continue »{ 17 Comments }
Participate in Microsoft BI DataMashUp Contest & You could win $3000 Prize
Published on Sep 15, 2011 in Charts and Graphs, Excel Challenges

Hello Data Junkies & Chart Lovers, I have a fun announcement for you. If you like to analyze data and present results in charts, then you can win up to $3000 in prizes by participating in Microsoft’s BI DataMashUp Contest. The contest is on from September 8th and runs until 28th. How to Participate in […]
Continue »{ 5 Comments }
80% Discount on PUP & PowerPivot Contest – Hurry up!
Published on May 3, 2011 in excel links

Since I am busy with background work on VBA Classes launching next week, today I want to give you two quick updates.
1. John Walkenbach is offering 80% discount on his Power Utility Pack Excel add-in, only today (3rd May) between 11AM-1PM EST.
2. You can win an XBOX 360 + Kinect by participating in PowerPivot Nerdtastic Quiz on their facebook page.
Read more to get the details about these two.
Continue »{ 101 Comments }
What is new in Microsoft Excel 2010? [Office 2010 Week]
Published on May 17, 2010 in Featured, Learn Excel
![What is new in Microsoft Excel 2010? [Office 2010 Week]](https://chandoo.org/img/2010/excel-2010-whats-new.png)
Office 2010, the latest and greatest version of Microsoft Office Productivity applications is going to be available worldwide in the next few weeks. I have been using Office 2010 beta since November last year and recently upgraded my installation to the RTM version. I was pleasantly surprised when I ran Microsoft Excel 2010 for first time. It felt smooth, fast, responsive and looked great on my comp.
This week, I want to celebrate the launch of Excel 2010 and write about the following new features in Excel 2010.
Also, you can win a copy of Office 2010 – home & student edition by leaving a comment on this or any of the other excel 2010 posts scheduled for this week
Continue »{ 24 Comments }
What is PowerPivot? (and does it really wear underwear on top of pants !?!)
Published on Jan 8, 2010 in Charts and Graphs

Along with Excel 2010, Microsoft released a free add-in called PowerPivot. According to MS, PowerPivot gives users the power to create compelling self-service BI solutions, facilitates sharing and collaboration on user-generated BI solutions in a Microsoft SharePoint Server 2010 environment, and enables IT organizations to increase operational efficiencies through Microsoft SQL Server 2008 R2-based management […]
Continue »
