All articles with 'pivot tables' Tag
{ 12 Comments }
Product Recommendation – Excel Dashboard Training Kit
Published on Jan 14, 2010 in Charts and Graphs, products

If you want to make better charts and create lasting impressions, chances are you have heard about Jorge Camoes. He writes at excelcharts.com (previously charts.jorgecamoes.com). I have been reading Jorge’s blog for over 2 years now and have linked to his excellent articles on PHD several times. Jorge also has an Excel Dashboard Training Kit, which teaches us how to make a dynamic and comprehensive excel dashboard. The dashboard training kit is a culmination most of his lessons implemented in a practical way using Excel.
In this article, I review the product and tell you why you should get a copy of it.
Continue »{ 24 Comments }
What is PowerPivot? (and does it really wear underwear on top of pants !?!)
Published on Jan 8, 2010 in Charts and Graphs

Along with Excel 2010, Microsoft released a free add-in called PowerPivot. According to MS, PowerPivot gives users the power to create compelling self-service BI solutions, facilitates sharing and collaboration on user-generated BI solutions in a Microsoft SharePoint Server 2010 environment, and enables IT organizations to increase operational efficiencies through Microsoft SQL Server 2008 R2-based management […]
Continue »{ 115 Comments }
Sales Dashboards – Visualizing Sales Data – 32 Dashboard Examples & Implementations
Published on Jan 4, 2010 in Charts and Graphs, Featured

Sales reports and dashboards are very common in any company. There are several ways in which you can visualize sales data to understand the trends and sales performance. So in November, I have asked you to visualize sales data using sample data. The visualization challenge #2, sponsored by Zoho Reports generated a huge buzz around the community and fetched 32 incredible entries. The response was so overwhelming that it took me almost 24 hours to write this post. Thanks everyone for participating and making this a huge learning experience for everyone. Personally I have learned several useful dashboard and charting tricks. I will be sharing some of these lessons with all of you in the coming weeks.
Continue »
Today I want to introduce Excel 2010 to you. Excel 2010 is the latest version of spreadsheet software from Microsoft, set to be released for sale in late 2010. On Nov 18th, MS released the public beta of Excel 2010 [download here] along with other Office productivity software.
Excel 2010 has several improvements compared to earlier version – Excel 2007. In this post, I want to highlight some of the User Interface improvements made in Excel 2010 that are very exciting and fun to use.
Continue »{ 115 Comments }
Grouping Dates in Pivot Tables
Published on Nov 17, 2009 in Learn Excel, Pivot Tables & Charts
Do you know you can group dates in pivot tables to show the report by week, month or quarter? I have learned this trick while doing analysis on a pivot table today. In this online lesson on pivot tables, I will teach you how to group dates in pivot tables to analyze the data by month, week, quarter or hour of day.
Continue »{ 3 Comments }
Excel Links of the Week [Excel Dashboards Edition]
Published on Nov 16, 2009 in excel links
Over the weekend I spent some time to update the Excel Dashboards page. It now features more articles, downloads and resources for those of you making Excel Dashboards. Go ahead and check out the page here and let me know your feedback.
Moving on to this weeks excel and charting links worth checking.
Continue »{ 1 Comment }
Excel Links of the week [After a long time edition]
Published on Nov 9, 2009 in excel links
It has been a really long time since we have an excel links post here. That doesnt mean I am not reading anything exciting. It is just that I have gotten busy being a dad. But now that I am in to a saner schedule, we are bringing back the excel links. Here is a […]
Continue »{ 21 Comments }
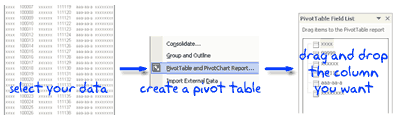
Make a Pivot Table in Excel [15 Second Tutorial]
Published on Aug 25, 2009 in Excel Howtos
![Make a Pivot Table in Excel [15 Second Tutorial]](https://chandoo.org/img/l/make-a-pivot-table-in-excel-tutorial.png)
Last week we have posted a simple to understand excel pivot table tutorial here. Today I am going to supplement the tutorial with a 15 second video tutorial on Making excel pivot tables.
Continue »{ 4 Comments }
Member of month, Excel links and Cooked HDD
Published on Aug 11, 2009 in blogging, excel links

Starting this month I will announce one member of our little community as member of month. It is to honor the contribution they made.
Jeff Weir is our member of month for July, 2009. He not only commented more than 40 times in the last month, but he even wrote a marvelous guest post on the chart busters series. I have learned several valuable excel and charting tips from him in the past few weeks. I am sure some of have too. Thank you Jeff.
Also in the post we have some excel links worth checking.
Continue »{ 78 Comments }
Sumif with multiple conditions [quick tip]
Published on Jul 22, 2009 in Excel Howtos
![Sumif with multiple conditions [quick tip]](https://chandoo.org/img/l/sumif-with-multiple-conditions.png)
Here is a little formula trick if you need to sum a range of cells based on multiple conditions.
Assuming you have the starfleet, captain and flight data, you can use the good old sum() in an array formula to conditionally sum values meeting multiple criteria. Read on to learn this quick tip.
Continue »{ 27 Comments }
One more method to find unique values in excel and you can call me a dork
Published on Feb 3, 2009 in Excel Howtos, Learn Excel
Use Excel Pivot tables to find and extract unique items in your data. This method is very fast and easily scalable.
Continue »
