
 If you want to make better charts and create lasting impressions, chances are you have heard about Jorge Camoes. He writes at excelcharts.com (previously charts.jorgecamoes.com). I have been reading Jorge’s blog for over 2 years now and have linked to his excellent articles on PHD several times. Jorge also has an Excel Dashboard Training Kit, which teaches us how to make a dynamic and comprehensive excel dashboard.
What is Excel Dashboard Training Kit?
Jorge teaches a lot of charting and excel lessons at his blog excelcharts.com (I recommend that you subscribe to his blog, it is very good). The dashboard training kit is a culmination most of his lessons implemented in a practical way using Excel.
Jorge takes the demographic data of all countries in the world and creates an impressive dashboard out of it and teaches us how to do the same using this training kit. The training kit contains several videos explaining dashboard creation process as well as the dashboard excel files.
(take a look at final dashboard)
In the videos Jorge explains the process of dashboard creation by taking us thru,
- How to connect Excel to Access to get data for the dashboard
- How to create pivot tables from external data in MS Access
- How to make charts from data in pivot tables
- Putting the charts together in the dashboard (and adding form controls)
- Adding macros to control the dashboard (and refresh data, animate charts etc.)
- Final formatting touches to make it look better
The videos are structured in clear steps with lots of comments. Each video can take between 30 to 45 minutes to carefully watch and understand the concepts.
There are several valuable excel charting, formula, pivot table and VBA tricks and practical tips spread through out the tutorial vidoes. For eg. in the video “Creating pivot tables” Jorge teaches us how to make GETPIVOTDATA formula dynamic, how to fix pivot table layouts, how to get top10 values in pivot tables based on a data column. Most of these tricks are completely new to me. I have been replaying some of these videos whenever I have some time to keep the ideas fresh.
The final dashboard is shown to the right. (it is the non-VBA version, click on it for a larger image)
Benefits of Excel Dashboard Training Kit
If you have been reading PHD for a while, you will appreciate the necessity to know “tricks of trade” to make better charts and wow your audience. The dashboard training from Jorge is packed with tons of these.
In my opinion, this training will help you,
- learn about connecting to external data sources
- massaging (pre-processing) data so that you can create dashboard reports
- learn a handful of tricks and formula uses that you can apply anywhere
- format charts in aesthetically pleasing and info-graphically accurate ways
- connect the dots – charts, formulas, form controls, macros, pivot tables to make something outstanding
Who is this training for?
Make no mistake, this is not a training for absolute dummies. You should be familiar with basics of formulas & charting. You should not be afraid to experiment and practice the ideas in this. You should be familiar with Excel 2003 (as the training videos are all in Excel 2003). If you have never seen excel 2003, then you may not be able to relate several things to Excel 2007 ribbon menus.
What will you get with this kit?
When you purchase a copy of excel dashboard training kit, you get,
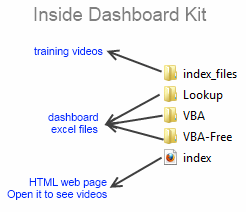
- One Excel dashboard linked to MS Access (without VBA)
- One Excel dashboard linked to MS Access (with VBA)
- One Excel dashboard (all data inside, noVBA)
- One Access DB with all the data
- Training Videos and HTML web pages to see them
- Free access to online training videos showing how to do this in Excel 2007 (only if you get this before Feb 1)
How much is the Excel Dashboard Training
For a limited time (until Feb1st), Jorge is selling the dashboard training kit for $47. This includes the free access to upgrades once they are released. Trust me when I say this is a HUGE bargain.
My Review & Opinion
Jorge is a widely respected authority on charting. His commentary is always insightful and practical. In this training videos, he brings all his experience to teach us how to make better dashboards, charts, how to connect to external sources and how to manipulate pivot tables.
My only gripe is that these videos do not have any audio. But Jorge provides compelling video with lots of comments & interactivity to bridge that..
I recommend the dashboard training kit for anyone making dashboard reports frequently or aspiring to make them using Excel.
(for free dashboard tutorials and templates visit PHD’s excel dashboards page)
Any questions?
Do you have any questions about this product? Please drop a comment. I have asked Jorge to answer your queries here directly.
Also, if you bought a copy of this, please share your review here, it will help others.
Disclosure:
Jorge is a friend of mine. I have received a complimentary copy of this training kit. I also get a small commission when you buy a copy of the product. But I am sure you will derive more benefit out of this than what Jorge or I make.
Go ahead and get the dashboard training kit.


12 Responses
Chandoo, thanks for the review, you are too kind.
Let me just add something regarding the updates: The new version will be available online and all current users (as of Feb. 1) will have access to both Excel 2003 and Excel 2007 versions.
I must say I´m very temped to buy this product.
OT: If you are interested in demographic data and presentations you should visit
http://www.gapminder.org/
and check out this fellow Swedish of mine.
Here you can see a great presentation when he speaks at TED:
http://www.youtube.com/watch?v=YpKbO6O3O3M
(If you dont have time to watch the whole clip you should watch from 17:21, without reveling to mucth let me just say he finish the presentation in a very special way)
@Jorge… I want to make sure readers get the to know about the best products out there.
@Loranga… Hans is one of our favorites here at PHD. I regularly watch his talks and link to them here (as well as on my twitter)
I am really sorry to say that, but the current version (01/16/10) is NOT worth the money (my opinion). I mean, hey, that’s nearly 50 bucks and there are several minor and major issues:
– the overall structure is not very good, seems a little chaotic. There seems to be no system in defining names. Also there are some names defined in the example (final) file, which are not explained in the videos but are vital to the success of the model to work
– the code (VBA) in Jorges file is different than the one developed in the videos. Very hard to find things in when comparing both files. Also nearly NO comments are made in the code, which – from my personal perspective – is not good coding behavior. Also looks like some comments should explain the code but they stop in the middle of the sentence (“Please note that this macro” for example – that’s it, nothing more 🙁 )
– some things are simply not explained, i. e. where to put several pieces of code or which form controls to assign them to
There are of course also some very positive things to mention:
– linking a pivot table to access was one of my highlights because this makes the whole thing so ultra-dynamic
– pre-recording with the macro recorder and adjusting the code through the VBA editor (yeah, I know, should be common practice)
– intense use of named ranges (define -> names) is absolutely lovely
– developing the first pivot table and then simply copying from this base is also very nice
I read in the comments above that there will be an update. I hope that Jorge fixes the mistakes and close some gaps that are there. Hopefully it’s not only the 2007 update because I like the dashboard you provided us with and also the overall approach.
BTW: Above is my personal opinion and of course has nothing to do with Chandoo or anyone else. Other people may have other opinions or experiences.
@inservo: thanks for your comment. Short answer: Yes I am aware of those issues and I believe they are corrected in the updated version for Excel 2003 and in the new version for Excel 2007. Every existing user will have free access to both. Are these fundamental issues? I don’t think so. The refund rate is extremely low, so I have to assume people actually like the tutorial. No, that’s not enough, but it’s a start.
There are always some trade-offs and some assumptions when you are creating a new product. You can’t please everyone at the same time, but if you are able to listen to your users and to act accordingly, in the end everyone gains. That’s why I’m moving from a downloadable file model to an online access model. It’s much easier to get feedback and make changes that everyone has access to immediately.
Hope you’ll be an active member of the new community. We will certainly be able to discuss how to implement the rS1.method in version 3 of the tutorial.
Sorry to communicate via Chandoo fantastic blog, but HEY, that’s good news. I see you have noticed my fondness for the rs1.method ;-))) I promise I will be a member of the community and as mentioned above, the product still is so good, that I don’t want a refund either… 🙂
The good:
-Great nuts and bolts approach to explaining dashboarding. I ran through it via my dual monitor set up at work, and it went by very quickly – for the most part.
-Clear demonstrations of each phase/component of the project
Minor point of improvement:
-One part of it requires a whole bunch of copy pasta and named ranges. Might not ruin everything if that gets included as a source file which will save some grind by the person doing the tutorial and maybe just having them name each range. Real excel ninja’s avoid grindy copy/paste at all costs:)
Great product though. The tutorial shows you everything you need to know to start implementing your new learning within a few days. I’m like—-I don’t know—3 days into it and I’m already starting to make use of this stuff in smaller elements. I’m probably not going to be dropping a full blown dashboard on my boss by Friday, but I think I’ll have a few charts and some nifty stuff to show off.
Worth mentioning if you’re like me and saying “I don’t know, is this within my sphere of excel knowledge?”, the answer is probably “yes”. Don’t fear it. None of the involved skills are really that steep. I would think most ‘excel people’ are amply qualified to get through the tutorial.
Overall: Great product. If you’re a visual learner, this is probably the best way to go.
Dan: thanks for the feedback. Regarding the “minor point of improvement”: if you are referring to the moment when the regions are defined, yes, I agree with you, lots of copy/paste. The new version offers a better solution with just a small pivot table. Again, its a matter of balance. I wanted to avoid VBA or use it at a level that makes sense to non-programmers. Often that means that the best solution for the end user is not as well optimized as more advanced Excel users or programmers would like.
Hi Chandoo, i’m fascinated with your blog. Can I still buy the kit?
@Santino Thanks for the comments. Yes, you can buy the kit. Just click on the links and follow the instructions 🙂
What number can I reach you at?