All articles with 'pivot tables' Tag
![Making your dashboards interactive [Dashboard Essentials]](https://img.chandoo.org/vp/grammy-bump-chart-replication-in-excel-demo.gif)
Everyone likes to be in control. Even my 2 year old daughter jumps with joy when she lays her hands on TV remote. She pushes the buttons and assumes it is working. It is another story that we rarely watch TV at home.
By adding an element of control, we can make our dashboard reports fun. Interactive elements like form controls, slicers etc. invite users to play with your dashboard, get involved and understand data by asking questions. That is why I recommend making dashboards interactive.
Today lets understand how you can make dashboards interactive.
Continue »{ 20 Comments }
Sort Pivot Tables the way you want [Quick tip]
Published on May 31, 2012 in Excel Howtos, Pivot Tables & Charts
![Sort Pivot Tables the way you want [Quick tip]](https://img.chandoo.org/pivot/custom-sorting-pivot-tables.gif)
Ever looked at a Pivot table & wondered how you can sort it differently?
“If only I could show this report of monthly sales such that our best months are on top!”
Well, there is a way to do it without sacrificing 2 goats or pleasing the office Excel god. Just use custom sorting options in Pivot tables.
Continue »
Pivot tables are a great way of summarising and consolidating data to produce summary reports.
One of the main limitations of Pivot tables is that they don’t natively return Text values.
This post looks at a method to work around this without the use of VBA.
Continue »
Hello folks,
My flight to Sydney has been lengthy but fun. I have reached here on Sunday morning (8AM) and spent most of the day with Danielle’s family. (Danielle is the founder of Plum Solutions. She is the one who invited me to Australia and planned this whole experience for me).
On Monday (30th April), I went exploring the city on foot. I had coffee in the beautiful Queen Victoria Building, attended 1PM church service at the magnificent St. Mary’s cathedral, walked thru Hyde park, went to Sydney central station, took at sneak peek at the new Apple store in down town, got back to my hotel, walked to Opera house to meet up with our readers.
Reader meetup at Sydney
We had 6 people turn up for the meetup. It was fun talking about Excel & our journey with these wonderful folks. Here is a pic (you can see the harbor bridge in background & 8 awesome Excel users in foreground, Click on it to enlarge).
{ 4 Comments }
Do you use Pivot Tables? What do you use them for & where do you struggle [Survey]
Published on Mar 2, 2012 in Pivot Tables & Charts
If you like to analyze data, then you would fall in love with Pivot Tables on first sight. Pivot tables are a powerful, dead-simple & lovely way to play with your data, automate your reports and save time. That said, not all of us know how to use them or how to get them to […]
Continue »{ 41 Comments }
Refresh All Pivot Tables at once [Quick Tip]
Published on Sep 19, 2011 in Learn Excel, VBA Macros
![Refresh All Pivot Tables at once [Quick Tip]](https://img.chandoo.org/q/refresh-all-pivots-at-once.png)
Pivot Tables are an integral part of Excel based reports. So it is no surprise that many of create multiple pivot reports in one Excel workbook. So when the underlying data changes, we often spend time refreshing individual pivot tables. Today, I want to share a quick tip about how to refresh all pivot tables […]
Continue »{ 1 Comment }
Excel Links – Updates on Singapore Workshop Edition
Published on Jun 27, 2011 in excel links
It has been a while since we had an Excel Links post. So here we are.
First, I want to update you about our Singapore Workshop.
As you know, we have opened the registrations for this workshop last week. If you are in Singapore and want to attend an Excel & Financial Modeling Workshop, Please consider joining us on July 8- 10. For details & enrollment, visit Singapore Bootcamp page.
Apart from the Singapore workshop, I was busy last week conducting live training at CapGemini, in their Hyderabad office on Excel & Dashboards. It was a very good experience. I learned a lot about practical challenges people face when doing sales reports etc. using Excel.
Continue »{ 35 Comments }
Switch Scenarios Dynamically using Slicers
Published on Jun 1, 2011 in Pivot Tables & Charts
Slicers are my new favorite feature in Excel. Introduced in Excel 2010, Slicers are like visual filters.
Now, we can use slicers creatively to make an interactive scenario manager in Excel, as you can see below. We will learn how to create this in Excel in today’s post.
Continue »{ 5 Comments }
80% Discount on PUP & PowerPivot Contest – Hurry up!
Published on May 3, 2011 in excel links

Since I am busy with background work on VBA Classes launching next week, today I want to give you two quick updates.
1. John Walkenbach is offering 80% discount on his Power Utility Pack Excel add-in, only today (3rd May) between 11AM-1PM EST.
2. You can win an XBOX 360 + Kinect by participating in PowerPivot Nerdtastic Quiz on their facebook page.
Read more to get the details about these two.
Continue »
Last week, we have learned what Pivot Table Report Filters are & how to use them.
Today, I am going to show, how you can use simple macro code to change the report filter value dynamically.
We will learn how to create the chart shown here.
Continue »{ 32 Comments }
What are Pivot Table Report Filters and How to use them?
Published on Apr 20, 2011 in Pivot Tables & Charts
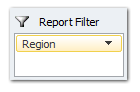
Today we will learn about Pivot Table Report Filters.
We all know that Pivot Tables help us analyze and report massive amount of data in little time. Excel has several useful pivot table features to help us make all sorts of reports and charts.
Report Filters are one such thing.
Continue »{ 14 Comments }
220 Excel Tips, Tutorials, Templates & Resources for You [Celebrating 20k RSS Members]
Published on Jan 20, 2011 in Charts and Graphs, Learn Excel
![220 Excel Tips, Tutorials, Templates & Resources for You [Celebrating 20k RSS Members]](https://img.chandoo.org/l/220-excel-tips-tricks-templates-resources.png)
I have an exciting news & massive post for you.
Chandoo.org reaches 20,156 RSS Subscriber mark on Jan 19, 2011As of Jan 19, 2011, our little blog has registered our 20,000th RSS Subscriber. While this is not a huge achievement or anything, It certainly calls for celebration. I am so happy to see our mission to make people awesome in Excel is reaching out to more people everyday. Thank you.
To celebrate this milestone, I am doing a massive post with 220 Excel tips, tricks, tutorials & templates.
Formulas [52 tips]
Formatting & Conditional Formatting [36 tips]
Charting [60 tips]
Tables & Pivot Tables [15 tips]
Using Excel [47 tips]
Free Downloads [5 tips]
Recommended Resources [5 tips]
{ 32 Comments }
Happy Birthday Hui, An Excel Dashboard to prove you are awesome!
Published on Jan 14, 2011 in Charts and Graphs, Cool Infographics & Data Visualizations
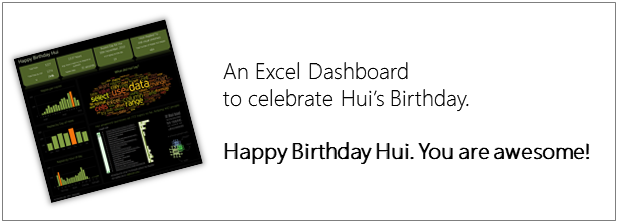
Some of you know our guest author and Excel ninja Hui. Yesterday was his birthday. And I wanted to create nice birthday gift for him. So I took a database dump of our forums data and created a dashboard.
Read rest of this post to see the dashboard & download workbook.
Continue »{ 65 Comments }
Make Dynamic Dashboards using Pivot Tables & Slicers [Video & Download]
Published on Dec 8, 2010 in Charts and Graphs, Pivot Tables & Charts
![Make Dynamic Dashboards using Pivot Tables & Slicers [Video & Download]](https://chandoo.org/img/dashboards/dynamic-excel-dashboard-using-pivot-slicers-demo.png)
Do you know that Excel 2010 makes creation of dynamic dashboards very simple?
Yes, that is right. Using slicers feature, you can create dynamic excel dashboards from your data in very little time. Today we are going to learn a technique that will help you create a dashboard like below.
Read rest of this post to find out how to construct a dynamic dashboard in Excel & download the example workbook.
Continue »{ 11 Comments }
Show Top 10 Values in Dashboards using Pivot Tables
Published on Dec 1, 2010 in Charts and Graphs, Pivot Tables & Charts
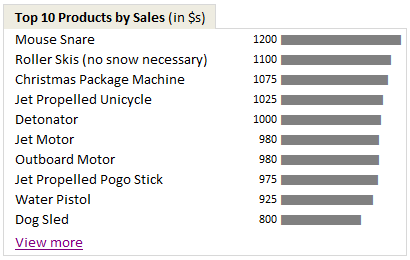
A good dashboard must show important information at a glance and provide option to drill down for details.
Showing Top 10 (or bottom 10) lists in a dashboard is a good way to achieve this (see aside). Today we will learn an interesting technique to do this in Excel.
Continue »
