All articles with 'OFFSET()' Tag
Find the Average of Closest 2 Numbers out of 3 [formula challenge]
![Find the Average of Closest 2 Numbers out of 3 [formula challenge]](https://chandoo.org/img/hw/average-of-closest-2-numbers.png)
Today I am asking you a tricky formula question. This is asked by Ionel on the Introduction to VLOOKUP, OFFSET & MATCH Formulas post. The question is, I have data in three columns: A,B,C and I want to get the average of the closest two values out of three in each row. Could you help […]
Continue »Happy Birthday Hui, An Excel Dashboard to prove you are awesome!

Some of you know our guest author and Excel ninja Hui. Yesterday was his birthday. And I wanted to create nice birthday gift for him. So I took a database dump of our forums data and created a dashboard.
Read rest of this post to see the dashboard & download workbook.
Continue »![2011 Calendar – Excel Template [Downloads]](https://img.chandoo.org/c/2011-calendar-template-download.png)
Here is a 2011 new year gift to all our readers – a free 2011 calendar template.
(a little secret: just change the year in worksheet “Full” from 2011 to 2012 to get the next year’s calendar. It works all the way up to year 9999)
You can add notes to individual dates or complete month using the excel template very easily. There are 6 different calendar templates in the download file,
* 4 Yearly Calendar Templates with different color schemes.
* 1 Mini Calendar
* 1 Monthly Calendar (prints in 12 pages)
Go ahead and download the calendar files. Enjoy.
Continue »
Introducing a method of allowing data points to be interactively highlighted in Excel Scatter / X-Y Charts and Line Charts.
You will see a lot of these style charts in various places where you want to highlight various aspects of the chart to your audience. It is a great technique for complex scientific and engineering charts where you may have hundreds or thousands of points.

Once you start using Excel to develop systems, budget, forecast and large tables of data you may come across the dilemma of “How do I know this is right” or “How do I truth check this”.
This post will add a tool to your arsenal to help you out.
First some personal matters. Today I am celebrating my 28th birthday. The last one year has been very good for us. We have been very busy parenting 2 hilarious and naughty twins, I moved back to India, quit my job and started a company. My business became a mild success crossing $100k revenues in 12 […]
Continue »
Hello Folks.
I have a rather bad news for you. My internet service provider (TATA Photon) has mysteriously blocked chandoo.org. My site hasn’t been loading since Sunday. While, I know it is up and running, I cannot see it unless I go thru a proxy server.
It may take a few days to get this resolved. I am using this time to take a break from blogging and finish reading a few books.
But I have a contest for you that will keep you busy. Share your favorite VLOOKUP tip / trick and you can win an iPod Nano. Read more for rules & how to participate.
Continue »
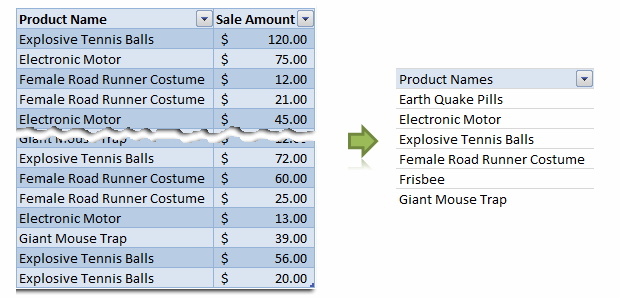
Removing duplicate data is like morning coffee for us, data analysts. Our day must start with it. It is no wonder that I have written extensively about it (here: 1, 2, 3, 4, 5, 6, 7, 8). But today I want to show you a technique I have been using to dynamically extract and sort […]
Continue »Make your data validations dynamic! [quick tip]
![Make your data validations dynamic! [quick tip]](https://chandoo.org/img/q/dynamic-data-validation-demo.gif)
Ok, since excel school 3rd batch is going to open on 15th, I wasnt going to write anything today. I have slept just 4 hours last night, blame it on work (and that funny video on youtube). But I found 30 minutes free time, so here you go, a quick but delicious tip on making your data validation dynamic.
Dynamic Data Validation?!? What in the name of slice bread and peanut butter is that?
See the demo aside to understand and read on to master the trick.
Continue »![9 Excel Tips & Downloads Submitted by Our Readers [Reader Awesomeness Week]](https://img.chandoo.org/raw/reader-awesomeness-week.png)
Last week I announced Reader Awesomeness Week to celebrate the passion, attitude and knowledge of our little community here. I got 9 interesting and beautiful entries from our readers. In this post you can see 9 tips & downloads submitted by our readers. These include a project management template, a macro to remove blanks, a technique to make Google Earth maps using Excel and several other interesting tips & tricks.
Go ahead and read them, download attached workbooks and become awesome in Excel. 🙂
Continue »How Francis Landed on Chandoo.org, Become Awesome and Made a Superb Dashboard, all in ONE Weekend
As part of our Reader Awesomeness Week, Francis shares with us a travel site dashboard he made for his company. Francis took just two days to prepare this awesome dashboard which uses concepts like bullet charts, sortable KPI grid, Date based filtering, dynamic charts and more. I was really moved by Francis’ gesture in sharing his work with us, so much that, I did a video review of his work. You can see it in the embedded youtube video to the left.
Read the rest of the article to know how this dashboard is made and get a copy of the file.
Continue »![How to Visualize Survey Results using Incell Panel Charts [case study]](https://chandoo.org/img/cb/survey-results-panel-chart-example.png)
A panel chart (often called as trellis display or small-multiples) shows data for multiple variables in an easy to digest format. It lets users compare in any way and draw conclusions with ease.
Today, I want to discuss how the principles of panel chart can be applied to visualize a complex set of survey results. For this we will use the recent survey conducted by Gartner on how various customers use BI (Business Intelligence) tools.
Continue »Data Validation using an Unsorted column with Duplicate Entries as a Source List

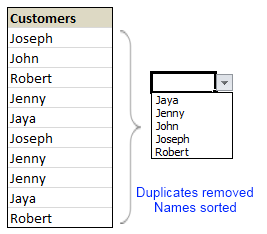
Here is a typical scenario: We want to allow only one of the pre-defined customer names in our spreadsheet. We have listed down all the customers in column B and want excel to check against this list and validate the data. But there are 3 problems. (1) Our list is not sorted alphabetically (2) It contains duplicates and (3) The list comes from external source, so we can not remove duplicates and sort the list every time.
Now how can we set up a simple data validation list that would not repeat customer names and shows them in sorted order like this.
Read the rest of this guest post by Hui to learn how to use data validation in creative new ways.
Continue »Top X chart – Show Top X values of a chart Interactively

Two charting principles we hear all the time are,
- Sort your data in a meaningful order before plotting it.
- Show only relevant information, not everything – because un-necessary information clutters the chart.
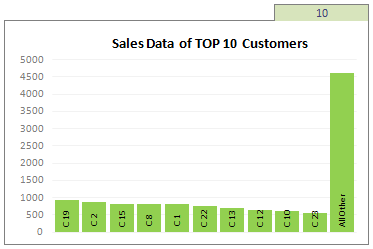
Today we will learn a dynamic charting technique that will mix these two ideas in a useful way. I call this a Top X chart.
Continue »Excel Links of the week [After a long time edition]
It has been a really long time since we have an excel links post here. That doesnt mean I am not reading anything exciting. It is just that I have gotten busy being a dad. But now that I am in to a saner schedule, we are bringing back the excel links. Here is a […]
Continue »

