All articles with 'Microsoft Excel Formulas' Tag
Check if a Word or Phrase is Palindrome using Excel Formulas [Weekend Fun]
![Check if a Word or Phrase is Palindrome using Excel Formulas [Weekend Fun]](https://img.chandoo.org/f/check-for-palindrome-excel-formulas.png)
The other day, while I was putting my kids to sleep, this idea came to me. How do I check if a cell contains a palindrome, using Excel formulas?
Next morning, I wrestled with excel for about 20 minutes and boom, the formula is ready.
But what is a palindrome?
A palindrome is a word, phrase, verse, or sentence that reads the same backward or forward. For example: A man, a plan, a canal, Panama!
So, to check if a cell contains palindrome, we need to reverse the cell contents and see if both original and reverse are the same.
Get busy this weekend, with OR XOR AND [Excel Homework]
![Get busy this weekend, with OR XOR AND [Excel Homework]](https://img.chandoo.org/hw/bitwise-operations-in-excel-howto.png)
Some of you have heard my neighbor’s dog bark in a video or two that I recorded. While I was busy explaining how to do something awesome in Excel, this dog would decide to bark, adding her own two cents to the lesson. Quite a few of my VBA class students have grown used to it. So much that they complain when a lesson doesn’t have a couple of woofs. But I digress.
So coming back, one of the dogs (probably stray) has decided that she should bring her infant puppies and hide them under our terrace stair case. So, now we have 2 cute little puppies barking day long (and very late in to the night) just outside my office window. We have tried hard to get rid of them, but they somehow sneak back in and start barking or crying. So, I will be busy this weekend trying to move them out.
But that doesn’t mean, you have to live Excel-less for a few days. So I have a homework.
OR XOR AND, Get busy this weekend!
Don’t worry. I am not speaking elvish or something. OR, XOR & AND stand for bit-wise operations. This week, your task is to write formulas in Excel that would get the bit-wise results for AND, OR & XOR.
Continue »
Last week we learned how to create dynamic hyperlinks in Excel. Today, I want to show you something even cooler. An interactive dashboard based on hyperlinks, like shown above.
Isn’t it impressive?
Well, to create something like this, you don’t need a degree in advanced cryogenics. You just need a bunch of data, a chart, a one line macro code and some pixie dust (go easy on pixie dust).
Continue »Create Dynamic Hyperlinks in Excel [Video]
![Create Dynamic Hyperlinks in Excel [Video]](https://img.chandoo.org/q/dynamic-hyperlink-in-excel.png)
During one my recent training programs, a participant asked an interesting question.
I have a list of values. I would like to place a hyperlink in my workbook that would always take me to the last value in the list.
Something like shown aside.
Click on the image to learn how this is done.
Continue »NPV() function to calculate Present Value

Today, let us learn how to use NPV() function in Excel & create a simple financial model.
If you are dealing with cash and valuations, you are bound to have come across the NPV function. If you don’t know the assumptions behind the same, I bet it could cost you your job!
Let’s take a simple project – You buy a MSFT stock for USD 100. You receive a dividend of USD 10 in the first year, USD 20 in the second year, USD 40 in the third year and then you sell it out for USD 140. If you could have alternatively put this money in bank at 10% interest rate, have you gained anything?
How do you model this in excel? In this tutorial we understand how you can use NPV to do this analysis and what kind of pitfalls you can land into!!
Continue »Comparing Lists of Values in Excel using Array Formulas

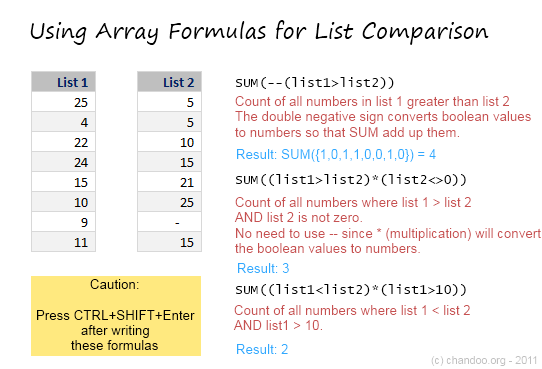
Last week, we had a home work on Calculating Donation Summaries using Excel Formulas. This is a good case where array formulas can help us. So today, we will learn how we can use Array Formulas to compare lists of values and calculate summaries. Towards the end of this post, you can see a video that explains the solution to Donation Summary Calculation problem.
Continue »Amount Donated vs. Pledged [Excel Formula Homework]
![Amount Donated vs. Pledged [Excel Formula Homework]](https://chandoo.org/img/hw/amount-donated-vs-pledged-data.png)
We have some home work folks! Today, lets test your Excel formula skills by giving some data related to a fund.
The problem:
You manage a fund for a non-profit. You have donors who pledge certain amount at the start of the year. As you go thru the year, the donors donate money to your fund. At the end of the year, you have a table like above. And you need to summarize the fund’s performance by calculating various statistics.
Go
Continue »
Many of us start using Excel to keep track of something. And along way, we realize that Excel has a powerful feature called formulas, using which we can automate a lot of things. BOOM! Before we realize, we are in the thick of VLOOKUPs and SUMIFs.
But, along way, we also pick up a few bad habits or believe a few myths. Today, lets bust 10 Excel formula myths that we hear often.
Read this post to learn what these myths and why you should not trust them.
Continue »
How often have you had a simple table where you want to lookup a value or add up some values meeting a criteria?
This post looks at a simple way to do a 2D Lookup or 2D Sum of a values from within a 2D range with multiple criteria, without complex Sum, Offset, Index, Match, Sumifs or other functions, simply using Sumproduct
Continue »Mod() function in excel to Implement Escalation Frequency [Financial Modeling Tutorials]
![Mod() function in excel to Implement Escalation Frequency [Financial Modeling Tutorials]](https://chandoo.org/wp/wp-content/uploads/2011/04/EscalationFrequency.gif)
You take an apartment on rent at $1000 per month and the owner puts an escalation clause saying 10% increment each 3 years. How do you model this in excel? In this tutorial we understand how escalations at certain frequency can be implemented using the mod function in excel. What is the mod() function Simply […]
Continue »
– Cue, alluring music.
Just like Jack and the crew of Oceanic Airlines flight 815, Excel has a number of LOST functions.
This post will look at some of Excel’s Undocumented, Unloved and Rarely used Functions
Comparing Sales of One Product with Another [Excel Techniques]
![Comparing Sales of One Product with Another [Excel Techniques]](https://img.chandoo.org/c/comparing-sales-of-one-product-with-another-demo.png)
This is a guest article by Theodor on how to Compare Sales of One Product with Another
Ok, now here’s one for you.
Suppose you’d like to come up with a sales report on different products, comparing their evolution on the same period of different years (say Jan ’09 vs. Jan Jan ’10). At the same time, you’d like to keep an eye on their yearly trend (entire 2009 vs. entire 2010).
Read on to learn how you can use Excel Charts to do this very easily.
Continue »
I know I am late to the party, but better late than…, uh! forget it.
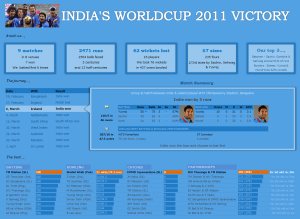
As the keen readers of our blog knew, I like cricket and I show my enthusiasm by making an excel dashboard (or info-graphic) whenever Indian team reaches a major milestone. So naturally, I was super excited when we won the ICC World cup 2011. Last time Indian won the event was in 1983 and my idea of a dashboard at that time was a bottle of milk and jingo-bell, my favorite shake-to-make-annoying-noise toy. I think our latest world-cup victory deserves something more than that. So here we go.
Continue »Auditing Spreadsheets? – Disable Direct Editing Mode to save time [quick tip]
![Auditing Spreadsheets? – Disable Direct Editing Mode to save time [quick tip]](https://chandoo.org/img/q/find-dependent-cells-by-disabling-direct-editing-model-excel-tip.gif)
For most of us, the prospect of inheriting a large, undisclosed sum of money is bleak. But we have high probability of inheriting a complex Excel workbook with 19 worksheets and 2300 rows of data and 195 formulas. The kind where entire rainbow colors are used to color code accounts receivable statuses. Then what do we do? We spend a whole afternoon (and then the rest of the month) breaking our head trying to figure out why the total revenues are only $ 41.2 million when profits are $ 99.23 million.
So how do we deal with our inheritance?
Here is a quick tip to help you get started. Disable “Direct editing mode“.
Continue »
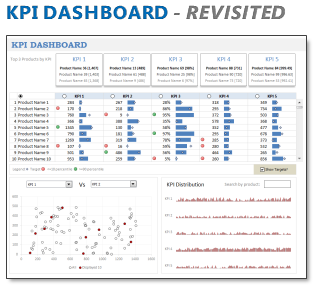
In 2008, I received an email from Robert Mundigl, which was the start of a life-long friendship. Robert asked me if he can teach us how to make KPI dashboards using Excel. I gladly said yes because I am always looking for new ways to use Excel.
The original KPI dashboards using Excel article was so popular. They still help around 12,000 people around the globe every month. Many of our regular readers and members have once started their journey on Chandoo.org from these articles.
In this article, we will revisit the dashboard and give it a fresh new spin using Excel 2007.
Continue »

