All articles with 'Microsoft Excel Formulas' Tag
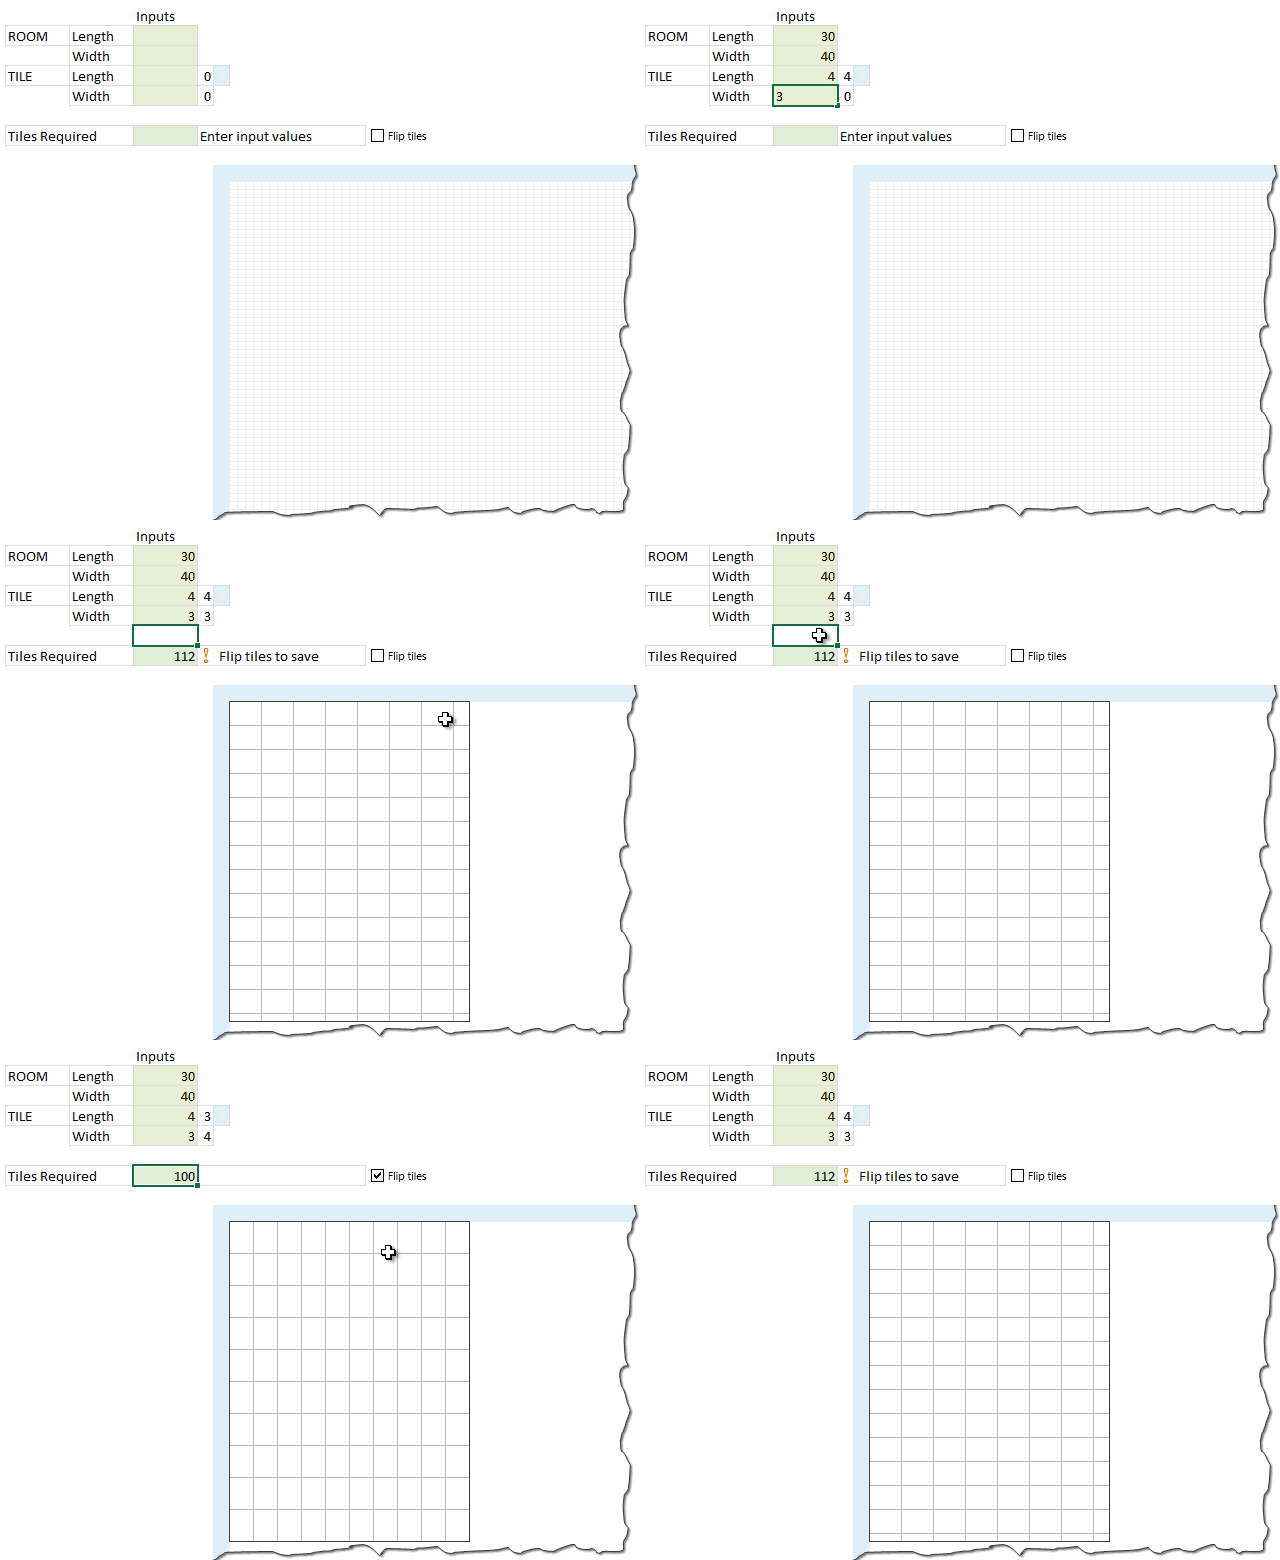
Modeling tiles in a room using Excel Conditional Formatting

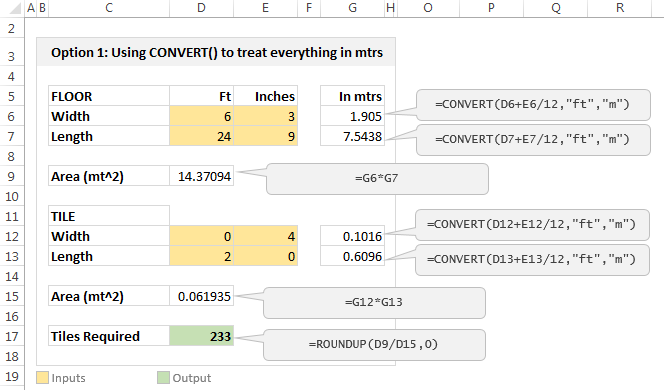
Last week we learned how to answer questions like, “How many tiles in a room?” using Excel. We learned about CONVERT function and fraction number format settings in Excel.
But why stop at calculation? We can even model a room full of tiles, thanks to Excel’s grid nature.
So today, we will learn how to create a room layout as shown above, using Excel.
Continue »Multiplying 24ft 9inches with 6ft 3inches using Excel

Imagine you are a carpenter and you are tasked with laying wooden floor at Gill Bates’ house. Now Gill B has a very big house and he wants to make sure you do a good job. So instead of asking you to lay the floor for entire house, he asks you to finish flooring in the guest bedroom first. Here are the dimensions of that guest bedroom.
- Width: 6ft 3inches
- Length: 24ft 9inches
- Size of individual wooden floor board: 2ft x 4inches
And here is the big question you are facing.
What?!? the guest bedroom width is only 6ft 3inches?
But over the years of chiseling and polishing you have learned to keep quiet and do your work.
So the real question you have is, How many wooden floor boards should you buy?
Of course, you want to find the answer using Excel. Why else would a carpenter read this blog?
Continue »Calculating Maximum Change [solutions & discussion]
![Calculating Maximum Change [solutions & discussion]](https://img.chandoo.org/hw/maximum-change-problem-solutions-and-video.jpg)
Last Friday, we had a fun little Excel challenge – Calculate Maximum Change. More than 170 people commented and shared their solutions to this problem.
And the best part?
The best part is the variety of solutions & thinking displayed by our community. So if you are one of those 170, puff your chest & pat yourself on the back. Go ahead, I will wait.
Today, lets take a look at some of these awesome formulas and understand how they work. Read on and watch the video you below to gain few awesomeness pounds.
Continue »CP002: VTALKUP – 5 Excel lookup functions demystified + 4 Resources for you

Podcast: Play in new window | Download
Subscribe: Apple Podcasts | Spotify | RSS
In the second session of Chandoo.org Podcast, We will be learning how to use 5 Excel lookup functions.
What is in this session?
In this session, we tackle one of the most important areas of Excel. The lookup functions.
You will learn,
- Why lookup functions are necessary
- 5 Important lookup functions in Excel – VLOOKUP, HLOOKUP, LOOKUP, MATCH & INDEX
- When & how to use each of these 5 functions?
- Extreme scenarios:
- What happens when the value you are looking up is not there?
- What if too many items match the lookup value?
- What if you have too many conditions in the lookup criteria?
- Using IFERROR function
- Re-cap of the new powers you acquired
- 4 Resources for you to learn lookup functions better
You can move formula help box with your mouse!!! [quick tip]
![You can move formula help box with your mouse!!! [quick tip]](https://chandoo.org/wp/wp-content/uploads/2014/03/move-formula-help-box-with-mouse.gif)
One of the most useful features of Excel is formula help box. You know the little yellow box that appears as soon as you start typing a formula in a cell. I use this all the time to understand what the syntax of a particular function is, what parameters to pass etc.
Although I love it, sometimes it does get in the way when writing formulas. Because the help box sits on top of my data, often I find it hard to know which cell to link to.
Solution?!?
Simple. Use your mouse to move away the help box wherever you want.
Continue »Handle Volatile Functions like they are dynamite

If you’re building large models, then you may want to use volatile functions – including OFFSET(), INDIRECT(), and TODAY() – with caution, because unless you know what you are doing, they *might* slow Excel down to the point that data entry is sluggish, if not downright tedious.
In fact, you *might* want to consider getting out of the habit of using these functions at all if there are alternatives, and you might want to replace volatile functions in your existing models with non-volatile alternatives…I have reduced recalculation time in large models from minutes to milliseconds by doing just that!
So what the heck does volatile actually mean? And why should you care? Let’s find out, shall we?
Continue »Can you extract first name & last name from email address? [Formula Challenge]
![Can you extract first name & last name from email address? [Formula Challenge]](https://img.chandoo.org/hw/formula-challenge-extract-first-last-name-from-email-address.png)
Today lets rescue John Doe from John_doe@email.com.
Extract first & last name from email address
Given an email address in the format
firstnameany_non-alphabet.characterslastname@email.com
You need to extract first name & last name using formulas.
Continue »Quick and easy Gantt chart using Excel [templates]
![Quick and easy Gantt chart using Excel [templates]](https://img.chandoo.org/pm/quick-gantt-chart-template-excel.png)
Gantt charts are a very popular way to visually depict project plans. Today, let us learn how to use Excel to make quick & easy Project Plan Gantt Chart.
This is what we will be creating.
Continue »Find first non-blank item in a list with formulas

Blank cells are an invisible pain in the analysis. Dealing with them is frustrating, time consuming and often very complex. At chandoo.org, we are not big fans of blank cells. That is why we wrote:
- How to delete blank cells & rows?
- Dealing with blanks – case study
- Quickly filling blank cells in a table
- Extracting non-blank data from a list
Today, lets talk about one more scenario. Lets say you want to find out the first non-blank item in a list. How would you do it?
Continue »Quickly combine text in multiple cells using this trick! [Formulas]
![Quickly combine text in multiple cells using this trick! [Formulas]](https://img.chandoo.org/q/combine-text-values-to-one-value-excel-trick.png)
Ever wondered how to go from a bunch of cells with text to one big combined text? Like shown above.
Well, there is a simple trick. One of our readers, Grant shared this with us. Read on to learn this.
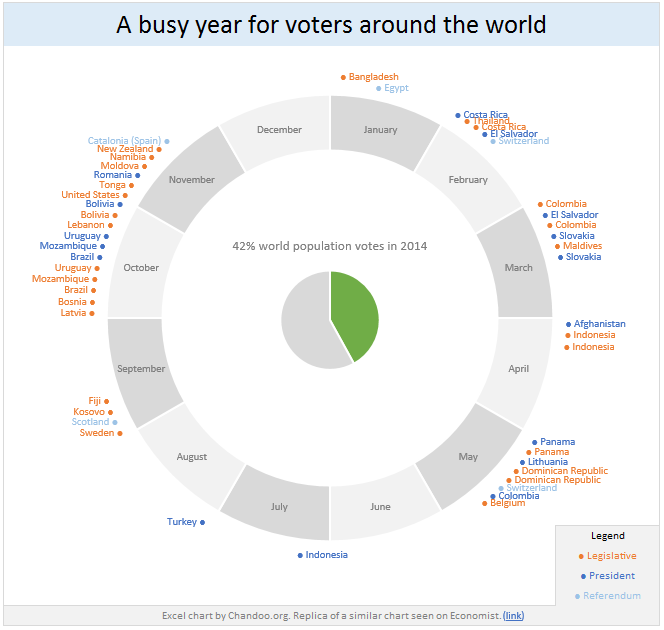
Continue »42% of the world goes to polls around a pie chart – Like it or hate it?

Today lets have a poll. Lets debate if this pie chart about world elections in 2014 is good or bad.
First lets take a look at the chart
This chart, published by The Economist talks about how 42% of the world population is going to vote this year. Take a look and read on to learn how you can re-create this in Excel.
Continue »Top 10 things I learned using Excel for a decade

Sometime during the 2nd half of 2013, I finished 10 years of Excel usage. In the last 10 years, I completed my studies, got my first job, married, had kids, visited 15 different countries, quit my job to start a business, bought first car, first house, made dozens of new friends, read 100s of books, wrote a book and learned 1000s of new things. And all along, Excel stayed a true companion. Right from MBA entrance exam preparation in 2003 to making my summer internship project reports in 2005 to planning my wedding expenses in 2007 to getting a promotion in 2009 to planning my kids feeding schedule in 2010 to running a successful business in 2014, Excel helped me in every step.
So today, I want to tell you the top 10 things I learned using Excel in last decade. Grab a hot cup of coffee, buckle your belts and get ready for time travel.
Continue »Free 2014 Calendar, daily planner templates [download]
![Free 2014 Calendar, daily planner templates [download]](https://chandoo.org/wp/wp-content/uploads/2014/01/free-calendar-and-daily-planner-template-2014.png)
Here is a New year gift to all our readers – free 2014 Excel Calendar & daily planner Template.
This calender has,
- One page full calendar with notes, in 4 different color schemes
- Daily event planner & tracker
- 1 Mini calendar
- Monthly calendar (prints to 12 pages)
- Works for any year, just change year in Full tab.
![Sporadic Totals in Excel [video]](https://img.chandoo.org/q/sporadic-totals-excel-example-data.png)
If this Excel problem is a Bollywood (Indian movie) plot, it would go like this:
Situation: Your boss gave you a worksheet. It has a lot of number chunks. And you need to calculate the sum of each chunk. Quickly!
Twist #1: The villain (your boss, who else) has abducted your spouse. For every extra hour you spend on the problem, your boss will make your spouse go thru one of the boring 97 slide strategy presentations. And his laptop is full of those strategy presentations.
Twist #2: The F1 key on your keyboard is missing.
Twist #3: The coffee machine in your floor is broken again.
Twist #4: And just when you are pressing CTRL+S, the movie steers in to an item song.
—-
Fortunately, no one abducted your spouse. And hopefully the coffee machine is working. But the Excel problem remains unsolved.
Continue »


