All articles with 'Learn Excel' Tag
{ 62 Comments }
Check if two ranges of dates overlap [Excel Formulas]
Published on Jun 1, 2010 in Learn Excel
![Check if two ranges of dates overlap [Excel Formulas]](https://chandoo.org/img/f/check-date-overlap-condition-excel-formula.png)
While preparing a project plan, I had a strange problem. I wanted to highlight all the project tasks that fall with-in a certain date range. At the lowest level, the problem is like this: There are 2 ranges of dates (a,b) and (x,y) and I want to know if they overlap (ie at least one […]
Continue »{ 9 Comments }
Official FIFA World-cup Soccer Balls since 1930 in an Excel Chart [Excel Fun]
Published on May 28, 2010 in Charts and Graphs
![Official FIFA World-cup Soccer Balls since 1930 in an Excel Chart [Excel Fun]](https://chandoo.org/img/vp/official-fifa-worldcup-soccer-balls-from-1930.png)
The FIFA World-cup 2010 edition is around the corner. Like millions of people around the world, I too am an ardent fan of football. (although, I have played only one game of soccer in which I waited near opponents goal post as I was too lazy to run around. And when my team mates kicked […]
Continue »{ 10 Comments }
Use CTRL+Back Space to jump to active cell [Shortcut]
Published on May 27, 2010 in Learn Excel
![Use CTRL+Back Space to jump to active cell [Shortcut]](https://chandoo.org/img/q/keyboard-shortcuts.png)
When I published the comprehensive list of excel shortcuts few weeks back, I thought I had them all. Boy, I was wrong. I am pleasantly surprised to find a new shortcut, one that takes away my manic mouse scrolling in one feel swoop. Often, when I am working with large tables of data, I scroll […]
Continue »{ 12 Comments }
Dynamic Dashboard in Excel – Pulling it all together [Part 4 of 4]
Published on May 26, 2010 in Charts and Graphs, VBA Macros
![Dynamic Dashboard in Excel – Pulling it all together [Part 4 of 4]](https://chandoo.org/img/ed/excel-dynamic-dashboard-final-th.png)
In the last installment of our dynamic dashboard tutorial, we will take all that we have learned in first 3 parts and combine that to create a final dashboard. We are going to use concepts like table of contents, macros and data validation to help us get ahead. You can find the entire macro and downloadable workbook inside the post. Read on…
Continue »{ 25 Comments }
Display Alerts in Dashboards to Grab User Attention [Quick Tip]
Published on May 25, 2010 in Charts and Graphs
![Display Alerts in Dashboards to Grab User Attention [Quick Tip]](https://chandoo.org/img/dashboards/dashboard-alerts-example-th.png)
Dashboards can be overwhelming with lots of details and context. A simple way to drag user’s attention to important stuff in the dashboard is to use alerts. See this example to understand what alerts mean. How to display alerts in Excel Dashboards? The easiest way to display alerts is to use Excel 2007’s Conditional Formatting […]
Continue »![An Excel Hero indeed [blog recommendation]](https://chandoo.org/img/r/excel-hero-blog.png)
Today, I want to introduce an excel hero to you. He may not be wearing red cape or carrying latest ninja weaponry with him. But he is a hero. He can arm twist toughest sets of data to create beautiful (almost art like) charts or animations. He can a complex vba model and make it […]
Continue »{ 17 Comments }
Understanding Backstage view in Excel 2010
Published on May 21, 2010 in Excel Howtos

In the last installment of excel 2010 features, we will explore the backstage view (or file menu) in Excel 2010.
Background on Backstage view:
Most of the windows based applications have a File menu. This is the usual place you go to create, open, save, save as, print and close. In Office 2007, Microsoft ditched menu based navigation and introduced Ribbon. They moved all the formatting, pivot, charting, formula, print etc. options to various individual ribbon tabs. But they couldn’t move the functionality of File menu to a separate ribbon. Instead, they moved all this functionality to Office button – a clone of file menu.
Continue »{ 5 Comments }
Attend Free Excel Training Session by Me on May 25th
Published on May 20, 2010 in Learn Excel

Fantastic news folks… As part of Office 2010 launch, Microsoft India is arranging a virtual launch event on May 25th and 26th. There are a ton of cool sessions on various Office products. I will be presenting on “Sparklines and Conditional Formatting” On May 25th between 3:30 – 5 PM IST (we are GMT + […]
Continue »{ 37 Comments }
Customize Excel ribbon – How-to guide, FAQs and Help
Published on May 20, 2010 in Excel Howtos

Starting Excel 2010, you can finally customize the ribbon UI and define your own tabs or groups. This can be a huge productivity boost for people using MS Office applications. In this post, learn how to customize excel ribbon to improve your productivity.
Continue »{ 49 Comments }
New Features in Excel 2010 Conditional Formatting
Published on May 19, 2010 in Charts and Graphs, Learn Excel
Conditional formatting is one of favorite features in Excel. CF has helped me save the day at work more than a dozen occasions. I almost became project manager just because I knew how to make a gantt chart in excel using conditional formatting. I have written extensively about it.
So, I was naturally curious to explore what is new in Excel 2010’s Conditional Formatting. In this post, I will share some of the coolest improvements in CF.
Continue »{ 101 Comments }
What is new in Microsoft Excel 2010? [Office 2010 Week]
Published on May 17, 2010 in Featured, Learn Excel
![What is new in Microsoft Excel 2010? [Office 2010 Week]](https://chandoo.org/img/2010/excel-2010-whats-new.png)
Office 2010, the latest and greatest version of Microsoft Office Productivity applications is going to be available worldwide in the next few weeks. I have been using Office 2010 beta since November last year and recently upgraded my installation to the RTM version. I was pleasantly surprised when I ran Microsoft Excel 2010 for first time. It felt smooth, fast, responsive and looked great on my comp.
This week, I want to celebrate the launch of Excel 2010 and write about the following new features in Excel 2010.
Also, you can win a copy of Office 2010 – home & student edition by leaving a comment on this or any of the other excel 2010 posts scheduled for this week
Continue »{ 7 Comments }
Evolution of Privacy Policies on Facebook – a Panel Chart in Excel
Published on May 13, 2010 in Charts and Graphs, Cool Infographics & Data Visualizations

Out of curiosity I took the data from Matt McKeon’s Privacy on Facebook chart and try to re-do the chart in Excel. I made a panel chart depicting how Facebook’s privacy policies have changed since 2005. You can see a bigger version of chart as well as get the download excel from the post. Read on…
Continue »{ 32 Comments }
Introduction to Panel Charts using Excel – Tutorial & Template
Published on May 12, 2010 in Charts and Graphs, Featured
In this article we will learn what a Panel Chart is and how you can construct a panel chart in Excel.
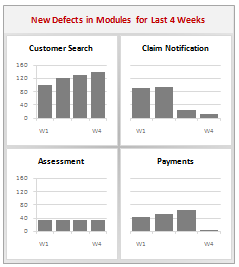
What is a Panel Chart?
A panel chart is a set of similar charts neatly aligned in panels to help us understand some data which has multiple variables in it. Panel charts are also called by names “trellis displays” or “small multiples”. They are an effective way to display multi-variable data.
Here is an example panel chart showing the total defects per module over the last 4 weeks.
Continue »{ 19 Comments }
Exclude Hidden Rows from Totals [How to?]
Published on May 11, 2010 in Excel Howtos, Learn Excel
![Exclude Hidden Rows from Totals [How to?]](https://chandoo.org/img/f/find-a-row-is-hidden-or-not-subtotal-formula.png)
Denice, an Excel School student emailed me an interesting problem. I have a bunch of data from which I want to find the sum of values that meet a criteria. But I also want to exclude any rows that are hidden. Well, we know how to find sum of values that meet a criteria – […]
Continue »{ 34 Comments }
How to become really awesome in Excel? [Reader Questions]
Published on May 10, 2010 in Learn Excel
![How to become really awesome in Excel? [Reader Questions]](https://chandoo.org/img/polls/excel-ninja.png)
Yusuf, one of the blog readers emailed me and asked “how I can bebome an expert in Excel”. I gave him some advice based on what I know. But I think My advice can be improved too. So I turn to you.
What do you think a person should do to become really awesome in Excel?
Share your thoughts, ideas and suggestions using comments. Suggest blogs, websites or books or anything that can help Yusuf (and countless others) really good in using Excel to become awesome in their work.
Continue »
