All articles with 'Learn Excel' Tag
Ladies & gentleman, put on your helmets. This is going to be mind-blowingly awesome.
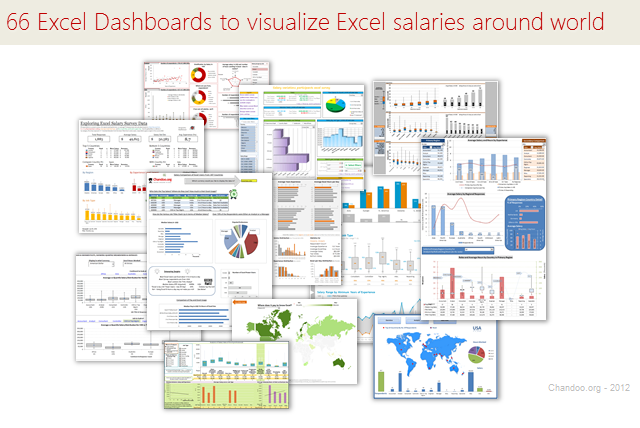
See how many different ways are there to analyze Excel salary data. Look at these 66 fantastic, beautifully crafted dashboards and learn how to one up your dashboard awesomeness quotient.
Continue »{ 9 Comments }
Welcome to Chandoo.org – A short introduction to our site
Published on Jul 27, 2012 in blogging, Learn Excel

Welcome to Chandoo.org. Thank you so much for taking time to visit us.
Over the last few weeks, we have quite a few new members to the site. Its good time I said hello and introduced this site to you.
PS: If you have been following chandoo.org for a while, you can still find useful information in this post. So read on.
Continue »{ 99 Comments }
Show only few rows & columns in Excel [Quick tip]
Published on Jul 24, 2012 in Excel Howtos
![Show only few rows & columns in Excel [Quick tip]](https://img.chandoo.org/q/show-only-few-rows-and-columns-in-excel.png)
Each new sheet in MS Excel comes up with a 1,048,576 rows and 16,384 columns. While it has a certain binary romantic ring to it (2^20 rows & 2^14 columns), I am yet to meet anyone using even half the number of rows & columns Excel has to offer.
So why leave all those empty rows & columns hanging in your reports?
Would it not look cool if your reports showed only few rows & columns as needed, like this:
Continue »{ 88 Comments }
Analyzing 20,000 Comments
Published on Jul 19, 2012 in Charts and Graphs, Cool Infographics & Data Visualizations
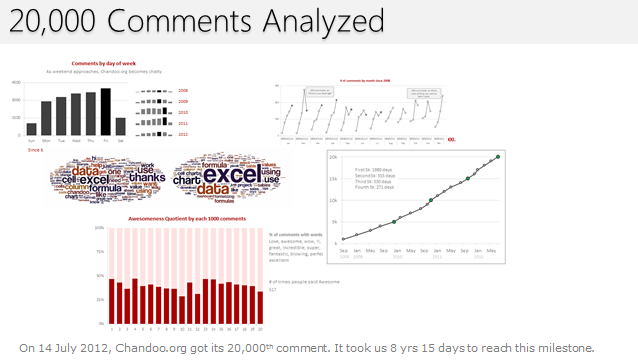
On 14th July, evening 4:51 PM (GMT), Chandoo.org received its 20,000th comment. 20,000!
The lucky commenter was Ishav Arora, who chimed, “Like super computers…Excel is a super calculator!!!!” in our recent poll.
It took us 8 years & 15 days since the very first comment to get here. And it took just 1 year 7 months & 23 days to add the last 10,000 comments (we had our 10,000th comment on 21st November, 2010).
Out of curiosity, I wanted to understand more about these 20,000 comments. So I downloaded our comment database, dumped it in Excel and start analyzing.
Continue »{ 0 Comments }
Financial Modeling School Price Hike from Tomorrow
Published on Jul 16, 2012 in Financial Modeling
Hi there,
How was your weekend? We had lovely weather. So spent most of the time playing with kids, running some errands & relaxing.
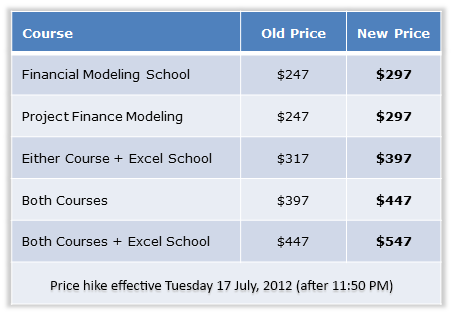
I just want to give you a quick update about our Financial Modeling School. We will be hiking course fees for this program starting tomorrow midnight (Tuesday, 17 July – 11:50 Pacific Time).
If you have been considering to join this program, please go ahead and enroll now to save money.
Click here for course details & Sign-up instructions.
Continue »{ 145 Comments }
How do you explain Excel to a small kid? [poll]
Published on Jul 13, 2012 in Learn Excel
![How do you explain Excel to a small kid? [poll]](https://img.chandoo.org/polls/what-area-of-excel-you-want-to-learn.png)
When I was in Perth, I visited Hui’s house one day. Lovely, Hui’s daughter (who is about 14) asked Hui how he knew me. So Hui told that we both share a passion for Excel and that;s how we got to know each other. Then she asked, What is Excel?
At this point, we both tried to explain what Excel is to her in a few ways with no success. Later Hui came up with a brilliant explanation.
He said, Excel has lots of small calculators all interconnected, so that you can do any sort of calculation.
So here is a challenge for you. How would you explain Excel to a small kid (computer literate, but not yet in college).
Continue »{ 70 Comments }
Highlight Row & Column of Selected Cell using VBA
Published on Jul 11, 2012 in Excel Howtos, VBA Macros
When looking at a big table of analysis (or data), it would make our life simpler if the selected cell’s column and row are highlighted, so that we can instantly compare and get a sense of things. Like above.
Who doesn’t like a little highlighting. So lets learn how to do highlighting today.
Continue »{ 21 Comments }
Visualizing Roger Federer’s 7th Wimbledon Win in Excel
Published on Jul 9, 2012 in Cool Infographics & Data Visualizations
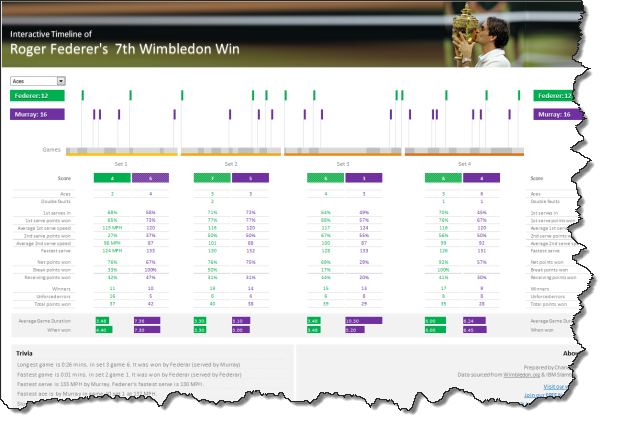
Did I tell you I love tennis? Some of my personal heroes & motivators are tennis players. And as you can guess, I admire Roger Federer. Watching him play inspires me to achieve more. So last night when he lifted Wimbledon trophy for 7th time, I wanted to celebrate the victory too, in my style. So I made an interactive timeline chart in Excel depicting his victory.
Continue »{ 25 Comments }
Creating a Masterchef Style Clock in Excel [for fun]
Published on Jul 5, 2012 in Charts and Graphs, Cool Infographics & Data Visualizations
![Creating a Masterchef Style Clock in Excel [for fun]](https://img.chandoo.org/c/mc/master-chef-clock-demo.gif)
Jo (wife) likes to watch Masterchef Australia, a cooking reality show every night. Even though I do not find contestant’s culinary combats comforting, occasionally I just sit and watch. You see, I like food.
The basic premise of the program is who cooks best in given time. To tell people how much time is left, they use a clock that indicates how much time is left (much like a stop clock, with a small twist).
One day, while watching such intense battle, my mind went
It be cool to make such a clock using hmm… Excel?
While I cannot share my snapper (or pretty much any other food item) with you, I can share my Masterchef style Excel clock with you. So behold,
Continue »{ 39 Comments }
Find the last date of an activity
Published on Jul 3, 2012 in Formula Forensics, Learn Excel
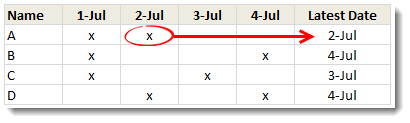
We know that using VLOOKUP, we can find a value corresponding to a given item. For example Sales of x. But what if you have multiple sales for each item and you want the last value?
Today lets understand how to find the last date of an activity, given data like above.
Like everything else in Excel, there are multiple ways to finding last date. If cats can use computers, they would hate Excel. You see, Excel is overflowing with unlimited ways to skin a cat.
Continue »{ 29 Comments }
Check if a list has duplicate numbers [Quick tip]
Published on Jun 28, 2012 in Excel Howtos, Learn Excel
![Check if a list has duplicate numbers [Quick tip]](https://img.chandoo.org/q/check-list-for-duplicates-in-excel.png)
A while ago (well more than 3 years ago), I wrote about an array formula based technique to check if a list of values have any duplicates in them.
Today, lets learn a simpler formula to check if a list has duplicate numbers.
Assuming you have some numbers in a range B4:B10 as shown below, we can use MODE + COUNTIF formulas to check if there are any duplicate values in a list.
Continue »{ 32 Comments }
Extract Numbers from Text using Excel VBA [Video]
Published on Jun 26, 2012 in Excel Howtos, VBA Macros
![Extract Numbers from Text using Excel VBA [Video]](https://img.chandoo.org/vba/extract-numbers-from-text-using-excel-vba.png)
Last week we discussed how to extract numbers from text in Excel using formulas. In comments, quite a few people suggested that using VBA (Macros) to extract numbers would be simpler.
So today, lets learn how to write a VBA Function to extract numbers from any text.
Continue »{ 26 Comments }
Visualize Excel Salary Data & You could win XBOX 360 + Kinect Bundle [Contest]
Published on Jun 25, 2012 in Excel Challenges
![Visualize Excel Salary Data & You could win XBOX 360 + Kinect Bundle [Contest]](https://img.chandoo.org/contests/excel-salary-survey-prizes.jpg)
Its contest time again! Put on your creative hats & bring your Excel skills to the game.
Analyze more than 1900 survey responses & present your results in a stunning fashion, and you could walk away with an XBOX 360 + Kinect Sports Bundle (valued at $299).
Sounds interesting? Read on.
Continue »{ 1 Comment }
Join our Financial Modeling Class before fee hike [Quick update]
Published on Jun 20, 2012 in Financial Modeling
![Join our Financial Modeling Class before fee hike [Quick update]](https://img.chandoo.org/fm/financial-modeling-fee-hike.png)
Hello lovelies,
I have a quick announcement to make. As you know, we run 2 online courses on Financial Modeling.
1) Financial Modeling School
2) Project Finance Modeling School
After running them for almost 2 years, we are now planning to hike the fees by $50. See below table to know about new fees.
Continue »{ 65 Comments }
Extracting numbers from text in excel [Case study]
Published on Jun 19, 2012 in Excel Howtos
![Extracting numbers from text in excel [Case study]](https://img.chandoo.org/f/extract-numbers-from-text-in-excel.png)
Often we deal with data where numbers are buried inside text and we need to extract them. Today morning I had such task. As you know, we recently ran a survey asking how much salary you make. We had 1800 responses to it so far. I took the data to Excel to analyze it. And surprise! the numbers are a mess. Here is a sample of the data.
Continue »
