All articles with 'downloads' Tag
{ 5 Comments }
Tweetboard Implementations – Download and make your twitter style dashboard today
Published on Jun 2, 2009 in Charts and Graphs, Learn Excel

Check out two fabulous implementations of tweetboards in excel. Download the workbooks and play with them yourself. Thanks Fernando and Lee for sharing these workbooks with us.
Continue »{ 72 Comments }
Statistical Distributions in Excel [spreadcheats]
Published on Jun 1, 2009 in Learn Excel
![Statistical Distributions in Excel [spreadcheats]](https://chandoo.org/img/n/frequency-excel-formula.png)
Excel has very powerful formulas and add-ins for performing almost any kind of statistical analysis. Today we will learn how you can make a statistical distribution of test scores using excel. There is a downloadable workbook too, for you to take a look at the formulas and play with them.
Continue »{ 4 Comments }
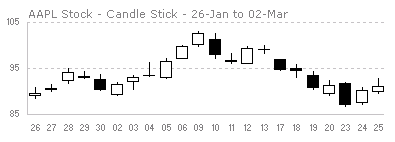
Intraday Candlestick Charting [Stock Charts]
Published on May 28, 2009 in Charts and Graphs
![Intraday Candlestick Charting [Stock Charts]](https://chandoo.org/img/n/intraday-candlestick-chart-thumb.png)
Gene asks me in an email, “I’m trying to graph candlestick charts in Excel for 10 minute candles. Excel seems to allow daily only with its stock templates. Can you point me to any resources for creating intraday candle charts?”. Of course, you can create intraday candlestick charts just the way you would create normal candlesticks, just change the axis options once you are done. Read the post to find more.
Continue »{ 18 Comments }
Tweetboards – Alternative to traditional management dashboards
Published on May 7, 2009 in Charts and Graphs, Featured
Here is a fun, simple and different alternative to traditional dashboards. Introducing….
{ 61 Comments }
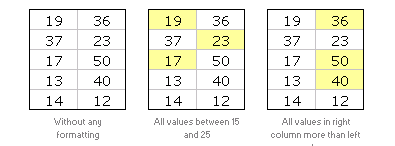
Highlight Top 10 Values using Excel Conditional Formatting
Published on Mar 17, 2009 in Excel Howtos, Learn Excel

In excel conditional formatting basics article, we have learned the basics of excel conditional formatting. In this article we will learn how to highlight top 5 or 10 values in a list using excel as shown aside. We will use LARGE excel formula and conditional formatting to do this.
Continue »{ 82 Comments }
Excel Conditional Formatting Basics
Published on Mar 13, 2009 in Excel Howtos, Learn Excel
Do you know What is excel conditional formatting? Learn the basics, few examples and see how you can use it in day to day work in this installment of spreadcheats.
Continue »
Today we will learn a little trick to compare 1 value with a set of values, For eg. our sales vs. competitor sales. We will learn how to create a chart like this.
Continue »{ 5 Comments }
Excel Links of the Week – Free E-Book Edition
Published on Mar 9, 2009 in blogging, excel links
Find out how you can get a free e-book on excel and charting in this week’s excel links.
Continue »{ 0 Comments }
RSS Icon using Donut Charts – Because it is Weekend
Published on Mar 6, 2009 in Charts and Graphs, Learn Excel
RSS Icon using Donut Charts – Because it is Weekend
Continue »{ 20 Comments }
Japanese Candlestick Chart – Excel Tutorial
Published on Mar 4, 2009 in Charts and Graphs, Learn Excel
Japanese Candlestick Chart or Candlestick Chart as they are popularly known are one of the most commonly used stock charts.Today we will learn how to make a candlestick chart in Microsoft Excel in 4 simple steps.
Continue »{ 10 Comments }
Market Segmentation Charts using Conditional Formatting
Published on Feb 18, 2009 in Charts and Graphs, Learn Excel
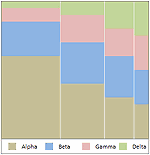
Trust Peltier to come up with solutions for even the most impossible looking charts. Today he shares a marimekko chart tutorial. I couldn’t sit still after seeing his post. So here comes market segmentation charts or marimekko charts using,
This week, check out the updated excel downloads page and 5 interesting excel articles from around the web. Read more to learn about a mouse trick to paste values, how you can tweet from excel using user forms, an intuitive charting principle and more.
Continue »
Learn how you can write your own twitter client using Excel. All it takes is excel, internet connection and 5 minutes of spare time.
Continue »{ 14 Comments }
Visualizing Search Terms on Travel Sites – Excel Dashboard
Published on Jan 19, 2009 in Charts and Graphs, Learn Excel
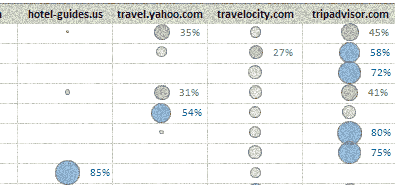
Microsoft excel bubble chart based Visualization to understand how various travel sites compete search terms
Continue »{ 25 Comments }
Sales Funnel Charts in Excel – Tutorial
Published on Jan 9, 2009 in Charts and Graphs, Learn Excel
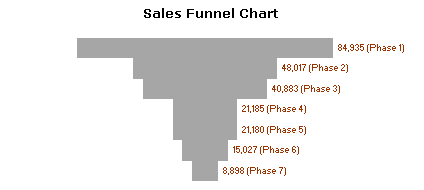
Sales funnel is a very common business chart. Here is a simple bar chart based trick you can use to generate a good funnel chart to be included in that project report.
Continue »
