All articles with 'reader questions' Tag
{ 10 Comments }
Reshaping your data easily – Case study [Pivot tables FTW]
Published on Mar 16, 2017 in Learn Excel, Pivot Tables & Charts
![Reshaping your data easily – Case study [Pivot tables FTW]](https://chandoo.org/wp/wp-content/uploads/2017/03/show-me-your-nose.jpg)
Late. Jayaram, my uncle is also a teacher. When I was a kid, I used to spend a lot of time with him, learning all sorts of things. He taught me chess, maths and so many life lessons. I remember one such lesson very vividly. One day, he asked me to do something. I did it in a very long way. After seeing me struggle for several minutes, he chipped in and showed me how to do it easily. He then said, “when someone asks you where your nose is, you don’t twist arm around your head. You just point to your nose directly.”
The idea is that when you have a direct, simple way to do something, you should use it.
Nose and pivot tables… how are they connected?
We are coming to the point. Read on for full case study and solution.
Continue »{ 92 Comments }
Can you solve this blood pressure problem? [IF Formula Homework]
Published on Nov 4, 2016 in Formula Challenges, Learn Excel
![Can you solve this blood pressure problem? [IF Formula Homework]](https://chandoo.org/wp/wp-content/uploads/2016/11/bp-category-problem.png)
Over on Facebook, Kristin asks, Help, my blood pressure is going thru the roof. I can’t seem to solve this blood pressure problem.
Let’s simplify Kristin’s problem.
You have some data in the format shown above.
And you want to find out the BP category for each reading, using some rules. Read on to solve the problem.
Continue »{ 39 Comments }
Tell me about an analysis problem that you couldn’t solve with Excel?
Published on Sep 9, 2016 in Analytics
Time for a quick show & tell.
Tell me about an analysis problem that you couldn’t solve with Excel?
It can be because you didn’t know how to solve the problem or Excel isn’t the tool for it or any other reason.
Go ahead and speak up. Post your tricky analysis problems in the comments section.
Continue »![Analyzing 300,000 calls for help [case study]](https://chandoo.org/wp/wp-content/uploads/2016/08/raw-data-first-onscene.png)
Over the weekend, I got an email from Mr. E, one of my students. Mr. E works at a police department in California and as part of his work, he was looking at calls received by police. Whenever police get a call for help, multiple teams can respond to the call and go to the location. All of these dispatches are recorded. So a single call can have several such dispatches. And Mr. E wanted to findout which team responded the first. The problem?
Finding the first responded team is tricky.
Today let’s take up this problem as a case study and understand various methods to solve it. We are going to learn about writing better lookups, pivot tables, power pivot and optimization. Put on your helmets, cause this is going to be mind blowingly awesome.
Continue »{ 21 Comments }
Find out how many times a value is present in a cell [formulas]
Published on Jul 19, 2016 in Excel Howtos, Learn Excel
![Find out how many times a value is present in a cell [formulas]](https://chandoo.org/wp/wp-content/uploads/2016/07/count-occurances-using-formula.png)
Here is an interesting problem to start your day.
Let’s say you work as DNA sequencing engineer at The Enterprise. And you just unlocked the sequence that is responsible for all male problems. The early onset of baldness. The sequence code is AAAA. And you want to find out how many times this sequence is found in a sample of DNA strings, in the range B6:B19. Essentially you want the above.
So how do you write the formula?
Continue »{ 15 Comments }
How to visualize multiple variables over several years? [Contest]
Published on Jun 24, 2016 in Charts and Graphs, Excel Challenges
![How to visualize multiple variables over several years? [Contest]](https://chandoo.org/wp/wp-content/uploads/2016/06/multiple-variable-chart-contest.png)
Our newest contest is inspired from a question asked by Kaushik, one of our forum members, interesting problem.
Need to quickly visualize 3 variables ( Company, years, Financials) in a single […] chart.
Create a chart to understand multiple variable data and you could win $100 Amazon gift card. Do send your charts before 4th of July to qualify for the prizes.
Continue »{ 13 Comments }
Generating sequence numbers from cluster values [VLOOKUP to the rescue]
Published on Jun 2, 2016 in Excel Howtos
![Generating sequence numbers from cluster values [VLOOKUP to the rescue]](https://chandoo.org/wp/wp-content/uploads/2016/06/generate-squence-numbers-problem.png)
Last night I got an email from Joshua, one of our readers with the subject – Hard Excel problem. Hard?!?, at this stage of summer, the hard problems seem to be (in no particular order),
- Lack of good quality mangoes to eat
- Intense heat and humidity
- Lack of good quality mangoes to eat
Yes, I like mangoes.
Any how, back to Joshua’s email, So I got curios and read it. He is facing a curious problem.
Continue »{ 2 Comments }
A slicer that doesn’t slice [Pivot Table Tricks]
Published on Mar 30, 2016 in Pivot Tables & Charts, Power Pivot
![A slicer that doesn’t slice [Pivot Table Tricks]](https://chandoo.org/wp/wp-content/uploads/2016/03/slicer-chart-confusion.gif)
Mary Ellen, one of our readers, has an interesting conundrum,
I have some data that goes to Pivot table then to pivot chart. There is a slicer to filter the data. But when I slice, my pivot chart gets messed up. How to have the slicer, but still see the insights in the chart?!?
See above demo to understand:
This is because when you slice by a school, the pivot table gets filtered and hence % row total for that school becomes 100% (as there are no other schools).
How to fix the problem? The easy answer is to remove the slicers. But we want to have our slicers and eat a slice of them too. So we crank up the Excel awesomeness valve and get to work. There are two ways to achieve what we want.
- Old school method: Two pivot tables, some formulas & a line chart
- New Excel method: Power Pivot and a line chart
Read the rest of this article to know more.
Continue »{ 29 Comments }
These icons are so pretty, can I get them in green? [conditional formatting trick]
Published on Mar 22, 2016 in Excel Howtos, Learn Excel
One of our readers emailed this question recently,
I like the conditional formatting icons. I am trying to present some business data where going down is good. How do I get a green colored down arrow icon?
Essentially, Ms. CanIGetItInGreen wants this:
Unfortunately, Excel’s conditional formatting icons are not customizable. So we can’t get the green down arrows without some sneak. And sneak we shall.
Continue »{ 13 Comments }
Unpivot and then pivot for clarity (case study)
Published on Mar 8, 2016 in Pivot Tables & Charts, Power Query

Or more appropriately titled, the one where Power Query solves the problem in less time than it takes you to say Get & Transform Data.
Recently, one of my students Mr. K, sent me a pivot table problem.
Today my boss asked me “how much we paid to staff since the inception of our business with their respective date of joining?” He wanted to know, level wise summary of the last 16 years (on Quarterly / Year wise basis).
The records appended from the database month wise. Have a look to the file and give your ideas.
Mr. K’s data looked like above.
Continue »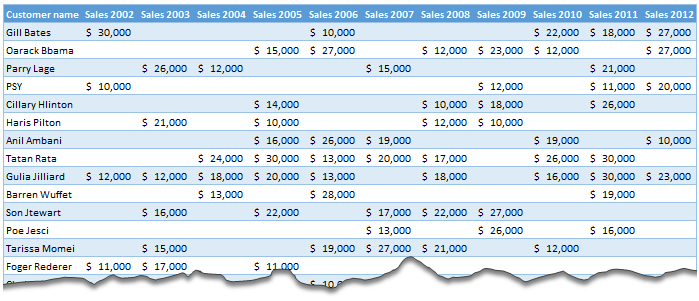
Moosa, one of our readers emailed this interesting question:
I have huge list of customers (around 1500).
Table includes following information
Customer # , Customer Name, Sales 2002, sales 2003, … sales 2012My requirements are
1. list of customer who did not have sales during all these years
2. List of customer who have not business from 2003
3. List of customer who have not business from 2004
Today, lets learn how to identify all the non-performing customers.
Continue »{ 15 Comments }
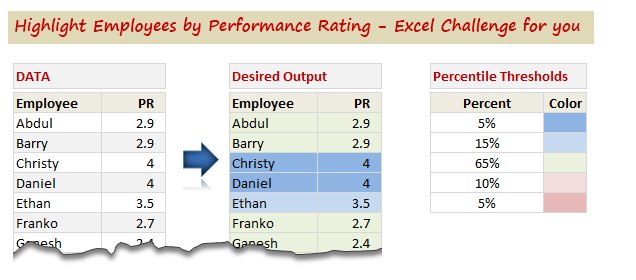
Highlight Employees by Performance Rating – Conditional Formatting Challenge
Published on May 18, 2012 in Excel Challenges, Learn Excel
So who is up for an Excel challenge?
Shelly, who is an HR Manager sent this distress call last week,
“I have a group of employees- lets say 100 employees. Each employee has a performance rating attached to them. I want to divide the group by 5%, 15%, 65%, 10%, 5% based on their performance rating.”
And that is our challenge today. Read on & help Shelly.
Continue »{ 21 Comments }
How to Filter Odd or Even Rows only? [Quick Tips]
Published on Jan 5, 2011 in Excel Howtos
![How to Filter Odd or Even Rows only? [Quick Tips]](https://chandoo.org/img/q/filtering-odd-or-even-rows-excel-howto-th.png)
Ashish sends out this SOS thru email, “I need your help in putting filters . Can we filter the cells on the basis of their even or odd character. i.e in the table of 1-1000, i wish to filter, 1,3,5,7,…”
An odd request, I must say. But nevertheless, possible in Excel.
Read this quick tip, If you want know how to filter odd or even rows only in a list of values.
Continue »{ 83 Comments }
Merge Cells without Losing Data [Quick Tip]
Published on Dec 7, 2010 in Learn Excel, VBA Macros
![Merge Cells without Losing Data [Quick Tip]](https://chandoo.org/img/vba/merge-cells-without-loosing-values.png)
Many of us face this problem. We have some data in a few cells. Either for alignment or structure, we would like to merge the cell contents in to one big cell. But Excel wont help as it cannot merge values from all cells.
Continue »{ 19 Comments }
Exclude Hidden Rows from Totals [How to?]
Published on May 11, 2010 in Excel Howtos, Learn Excel
![Exclude Hidden Rows from Totals [How to?]](https://chandoo.org/img/f/find-a-row-is-hidden-or-not-subtotal-formula.png)
Denice, an Excel School student emailed me an interesting problem. I have a bunch of data from which I want to find the sum of values that meet a criteria. But I also want to exclude any rows that are hidden. Well, we know how to find sum of values that meet a criteria – […]
Continue »
