6 Best charts to show % progress against goal

Back when I was working as a project lead, everyday my project manager would ask me the same question.
“Chandoo, whats the progress?”
He was so punctual about it, even on days when our coffee machine wasn’t working.
As you can see, tracking progress is an obsession we all have. At this very moment, if you pay close attention, you can hear mouse clicks of thousands of analysts and managers all over the world making project progress charts.
So today, lets talk about best charts to show % progress against a goal.
Road Trip Planner Template [Excel Downloads]
We recently went on a road trip around parts of New Zealand’s north island. We have been to Taupo, Rotorua, East Cape and Napier. It took us 2 weeks, we drove more than 2,000 km and spent almost NZ $3,000 on the trip. Of course, being a data nerd, I made a plan of the trip in Excel and that helped us budget for this.
After getting back to home, I thought it would be fun to polish the planner workbook and share it with you all so you too can plan a fabulous road trip. So here we go.
Stacked Bar/Column Chart with Indicator Arrows – Advanced
Lets take last weeks Stacked Bar/Column Chart and add some high-performance steroids.
I won’t eat donut with a thread inside, but lets make one anyway!
Today lets take a stroll outside what Excel can do and make something fancy, fun and may be useful.
Nowadays, many newspapers, websites and magazines are featuring info-graphics. An info-graphic is a collection of shiny, colorful & data-full charts (or often pieces of text.) In many of these info-graphics, you can see threaded-donut charts. Not sure what that is..? It is not same as the blasphemy of spoiling a soft, sweet, supple donut with a piece of string. No one should be excused for an offense like that.
What I am talking about is shown above
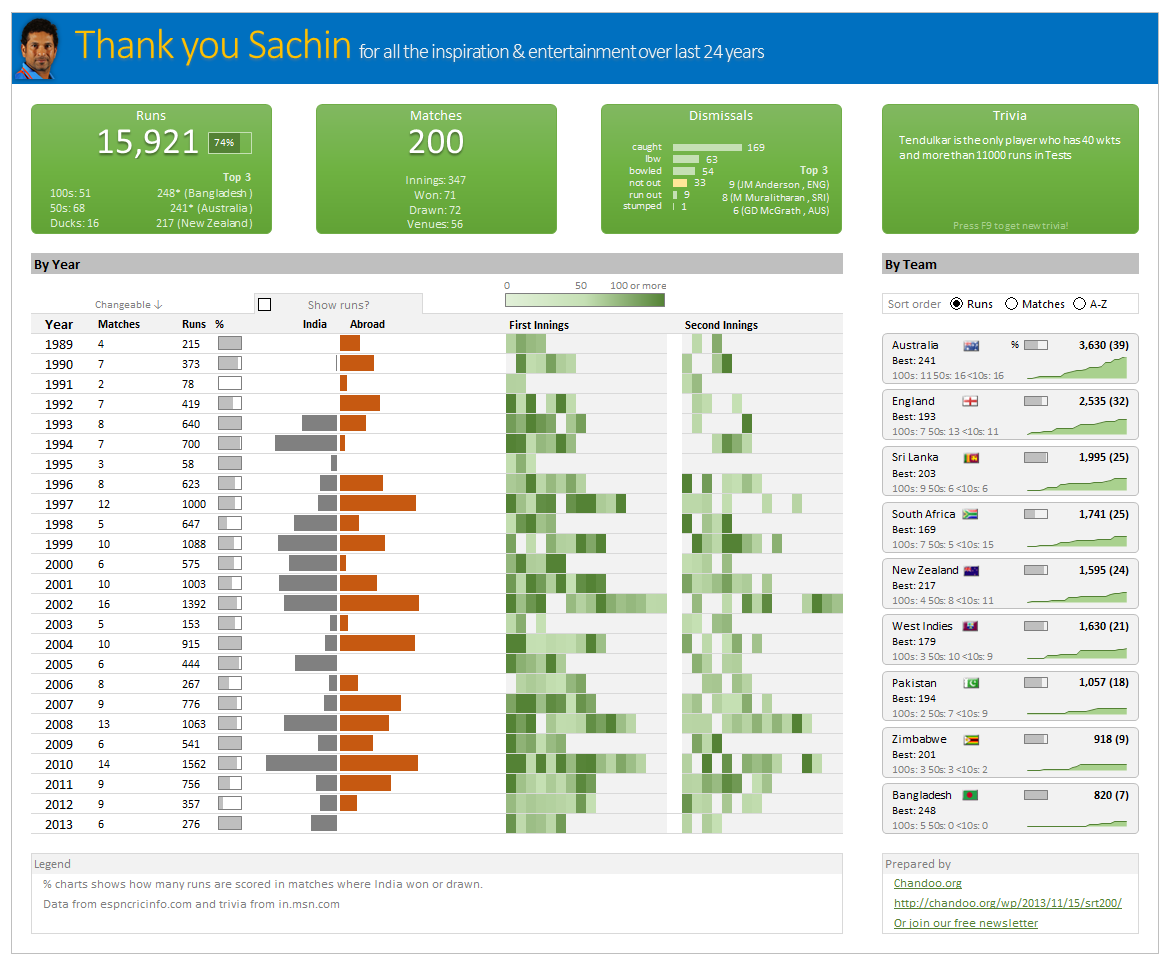
Thank you Sachin [a small tribute]
Lets talk about people who inspire us. People who show us that anything is possible. People who prove that commitment, hard work and perseverance are true ingredients of a genius.
I am talking about Sachin Tendulkar. Those of you who never heard his name, he is the most prolific cricketer in the world. He is the leading scorer in both tests (15,921 runs) and one day matches (18,426 runs). Read more about him here.
Tendulkar has been an inspiration for me (and millions of others around the world) since I was a kid. The amount of dedication & excellence he has shown constantly motivates me. It is a pity that the great man is retiring from test cricket. He is playing his last test match (200th, most by any person) as I am writing this.
So as a small tribute, I have decided do something for him. Of course, I have never been a cricketer in my life. Once in college I was reluctantly asked to be a stand-by player in a game with seniors. I did not get a chance to pad up though. That is the closest I have been to a cricketer. So I did what I do best. Create an Excel workbook celebrating Sachin’s test career.
Thank you Sachin – his test career in a dashboard
Here is a dashboard I made visualizing his test cricket statistics. It is dynamic, fun & awesome (just like Sachin).
(click on the image to enlarge)
To-do List with Priorities using Excel
A while ago, we published a new year resolution template. This was a hit with our reader with thousands of you downloading it. During last week, Peppe, one of our readers from Italy, took this template and made it even more awesome.
The original template had tasks and completion check mark. As you finish each task, you can see the progress bar moving.
Peppe added priorities to this. With his new version, progress is measured based on how much priority we assigned that particular task. Pretty neat eh?!?
Thermo-meter chart with Marker for Last Year Value
During a recent training program, one of the students asked,
Thermo-meter chart is very good to show how actual value compares with target (or budget). But how can we add another point for say Last Year value to the chart with out cluttering it.
Something like above.
Sounds interesting? Read on