All articles with 'templates' Tag
Track Your Mutual Fund Portfolio using Excel [India Only]
Excel is very good for keeping track of your investments. Due to its grid nature, you can easily create a table of all the mutual fund holdings and monitor the latest NAVs (Net Asset Values) to see how your investments are doing. A while back we have posted a file on tracking mutual funds using excel. Today we are going to release an upgrade for that file.
Read the rest of this post to understand how this template works and download the free template.
Continue »Make a Quick Thermometer Chart to Compare Targets and Actuals

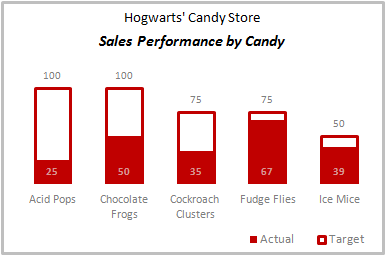
Comparing values is one of the reasons why we make charts. So today I am going to teach you a handy little trick to make a thermometer like chart to compare targets with actuals. This type of chart is very useful when you have a bunch of sales targets and you want to measure how the performance has been.
Continue »![2010 Calendar – Excel Template [Downloads]](https://chandoo.org/img/n/2010-calendar-thumb.png)
Here is a 2010 new year gift to all our readers – a free 2010 calendar excel file (a little secret: just change the year in “outline” sheet from 2010 to 2011, to get the next years calendar. It works all the way up to year 9999). You can even get a Printable PDF Calendar. There are 14 different sheets in the calendar file. First one is an outline calendar for the entire year. The next 12 are monthly calendars. And the last sheet shows a mini-calendar for the year 2010.
Read the rest of this post to know more and download the calendar.
Continue »![Personal Budget Spreadsheet [Downloads]](https://chandoo.org/wp/wp-content/uploads/2009/11/household-budget-spreadsheet-th.png)
At PHD household, we believe in using money wisely. Both Mrs. PHD and I come from very modest backgrounds. Our upbringing has taught us value of money in the most effective way – by exposing us to not having any. So when we got our first job (did I tell you that both Jo and I started working in same company and sat in same floor? Oh, it was such a lovely time), we were very prudent and decided not to waste money on anything trivial (we still are, just that over last 6 years our earning capacity increased a bit and we became parents).
Anyways, I am not here to bore you about my household. But I am here to tell you fun ways to track expenses and household budgets using spreadsheets.
Continue »
I have a super exciting news for all our members. During the last several weeks, I have been working on making 24 strikingly remarkable and easy to use excel templates for better project management. Finally the bundle is ready. You can get a copy of the bundle starting today.
Continue »Recipe for a Donut Bar Chart

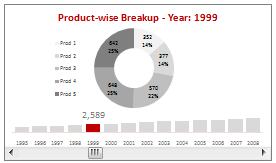
We all know that bar charts can be used to display values spread across various categories or times and pie charts / donut charts can be used to display percentage breakup of various quantities in a sum total. How about mashing up both to create a Donut Bar chart?
In this tutorial, you can learn how to make a donut bar chart and linking it to a form control to display Product-wise sales breakups spread across several years.
Continue »Issue Trackers & Risk Management using Excel [Project Management using Excel – Part 5 of 6]
Tracking issues and risks is where most of the project management time goes. Once the project planning and organizing activities are in good shape, most of the project management activities are around risk management and issue tracking. In this installment of project management using excel, we will learn how to create a simple issue tracker template using excel and how to analyze issues using excel.
Continue »Excel Time Sheets and Resource Management [Project Management using Excel – Part 4 of 6]
![Excel Time Sheets and Resource Management [Project Management using Excel – Part 4 of 6]](https://chandoo.org/img/pm/timesheets-excel-templates.gif)
Timesheets are like TPS reports of any project. Team members think of them as an annoying activity. For managers, timesheets are a vital component to understand how team is working and where the effort is going. By using Microsoft Excel capabilities you can create a truly remarkable timesheet tracking tool.
In this installment of project management using excel series, we will learn 3 things about timesheets and resource management using Excel
1. How to setup a simple timesheet template in excel?
2. How to make a more robust timesheet tracker tool in Excel?
3. How to use the timesheet data to make a resource loading chart?
Use burn down Charts in your project management reports [bonus post]
![Use burn down Charts in your project management reports [bonus post]](https://chandoo.org/img/pm/burn-down-chart.png)
A burn down chart is a good way to understand the progress of a project. It is like a run chart that describes work left to do versus time. In this tutorial we will learn how to make a burn down chart using excel. This is a bonus installment to the project management using excel series.
Continue »2009 Calendar Template in Excel – Now with week starting on Monday

Stružák, one of the commenters on the 2009 Excel Calendar Template post asked me if I can rearrange the cells in the calendar so that the week could start on Monday. Since I didn’t have access to internet for a while, I have asked him to make the necessary changes and mail it to me […]
Continue »Google Spreadsheets Holiday Art Template

This is pure fun! Few Googlers used the collaborative feature in Google Spreadsheets to create a holiday art template with snow flakes using 18 colors. Each of them added few colors on a blue canvas to create this massive template. The best part is they even made a time lapse video of the whole process […]
Continue »Excel Links of the Week – All Downloads at One Place Edition

25+ Excel Templates – Download and Use [plug] Have you ever wondered what it would be like to get all the excel downloadables in Pointy Haired Dilbert in one simple page? Well, I did and created this simple excel templates – download page. It has 27 templates currently and I will add more as and […]
Continue »
In Petal Charts – an Alternative to Radar Charts I have suggested using a radar chart tweak to replace the radar charts. Both PTSBlog and Information Ocean have posted their critical reviews of these petal charts. So as a penance for proposing petals, I am going to provide a tutorial on creating a comparison table […]
Continue »73 Free Designer Quality Excel Chart Templates – Grab now and become a charting superman
How many times you created a chart in Microsoft excel and formatted it for minutes (and sometimes hours) to reduce the eye-sore? Well, I will tell you my answer, its 293049430493 times 😉 Worry not! for you can become a charting superman (or elastigirl) by using these 73 free designer quality chart templates in literally […]
Continue »

