All articles with 'tables' Tag
{ 9 Comments }
Top 10 Excel formulas for IT people
Published on Jun 18, 2020 in Learn Excel, Project Management

Are you in IT & use Excel often? This article explains top 10 formulas for IT professionals. Useful for project managers, IT analysts, Testing people and BAs.
We cover a 10 practical situations and explore various Excel formulas to solve them. Example workbook provides more details too.
Continue »{ 3 Comments }
How-to create an elegant, fun & useful Excel Tracker – Step by Step Tutorial
Published on Mar 17, 2020 in Excel Howtos, Templates
Do you want to create a simple, elegant and useful tracker using Excel? You can make trackers with features like tables, data validation rules and conditional formatting. In this page, I will explain the process for creating an Excel tracker.
Continue »
Excel has hundreds of formulas. But as a new learner or user, you may want to just focus on top 10 formulas to get the most out of it. Assuming you already know the basics (check out Beginner Excel page if you are complete newbie), here is a list of top 10 Excel formulas for you.
Continue »
Excel table is a series of rows and columns with related data that is managed independently. Excel tables, (known as lists in excel 2003) is a very powerful and supercool feature that you must learn if your work involves handling tables of data.
What is an excel table?
Table is your way of telling excel, “look, all this data from A1 to E25 is related. The row 1 has table headers. Right now we just have 24 rows of data. But I can add more later!”
Continue »
Ok people. Let me tell you that this post is almost not about Excel. It is about how one Excel blogger’s (yours truly) dream of long distance cycling came true. So sit back, grab your favorite drink and read between sips.
So what is this all about?
Last Sunday (27th July) & Monday (28th), I finished my first ever 200KM bicycle ride. I rode for a little more than 12 hours, burned 5,179 calories & rode 206 kilometers.
It is definitely one of the most memorable, tiresome & uplifting experiences in my life. So naturally, I want to share the story with you.
Continue »![How to create interactive calendar to highlight events & appointments [Tutorial]](https://img.chandoo.org/vba/interactive-event-calendar-in-excel.png)
One of the popular uses of Excel is to maintain a list of events, appointments or other calendar related stuff. While Excel shines easily when you want to log this data, it has no quick way to visualize this information. But we can use little creativity, conditional formatting, few formulas & 3 lines of VBA code to create a slick, interactive calendar in Excel. Today, lets understand how to do this.
Continue »{ 3 Comments }
Highlight Quarters, Weekends in pivot reports using styles [quick tip]
Published on Nov 8, 2012 in Excel Howtos, Pivot Tables & Charts
![Highlight Quarters, Weekends in pivot reports using styles [quick tip]](https://img.chandoo.org/pivot/monthly-pivot-reports-with-quarter-highlighting.png)
Here is a quick pivot table tip.
When reporting summaries by month, it would be better to highlight 3 months at a time (Jan, Feb, Mar in one color, Apr, May, Jun in another color) than showing all in one color. Today, lets learn how to do this in easiest possible way.
Continue »
Can we make a calendar using Pivot Tables?!? Of course we can. Today let us learn a simple technique to create calendar style reports using Pivot tables. Thanks to Rob for inspiration Before making any progress, let me thank Rob from PowerPivotPro for the inspiration. Recently he wrote an article explaining how to use PowerPivot […]
Continue »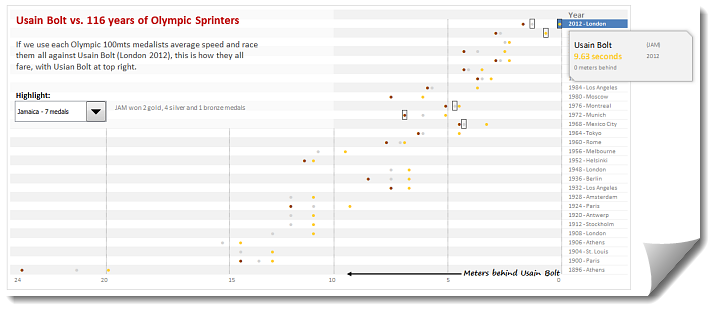
During London 2012 Olympics, Usain Bolt reached the 100mts finish line faster than anyone in just 9.63 seconds. Most of us would be still reading this paragraph before Mr. Bolt finished the race.
To put this in perspective, NY Times created a highly entertaining interactive visualization. Go ahead and check it out. I am sure you will love it.
So I wanted to create something similar in Excel. And here is what I came up with.
Continue »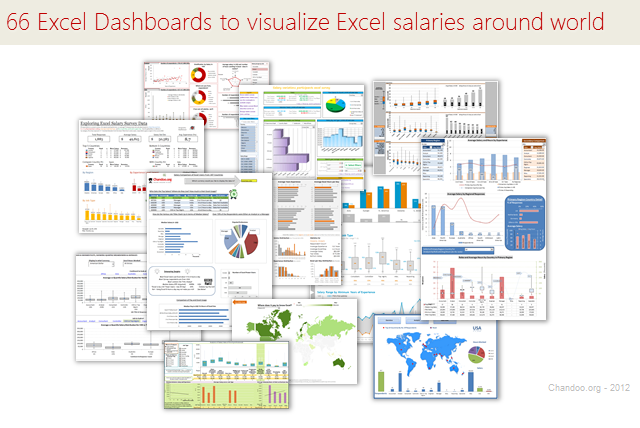
Ladies & gentleman, put on your helmets. This is going to be mind-blowingly awesome.
See how many different ways are there to analyze Excel salary data. Look at these 66 fantastic, beautifully crafted dashboards and learn how to one up your dashboard awesomeness quotient.
Continue »{ 1 Comment }
Excel Links – Updates on Singapore Workshop Edition
Published on Jun 27, 2011 in excel links
It has been a while since we had an Excel Links post. So here we are.
First, I want to update you about our Singapore Workshop.
As you know, we have opened the registrations for this workshop last week. If you are in Singapore and want to attend an Excel & Financial Modeling Workshop, Please consider joining us on July 8- 10. For details & enrollment, visit Singapore Bootcamp page.
Apart from the Singapore workshop, I was busy last week conducting live training at CapGemini, in their Hyderabad office on Excel & Dashboards. It was a very good experience. I learned a lot about practical challenges people face when doing sales reports etc. using Excel.
Continue »![Show Details On-demand in Excel [Tutorial + Training Program]](https://img.chandoo.org/c/on-demand-analysis-and-details-in-excel-demo.gif)
Yesterday, we have seen a beautiful example of how showing details (like distribution) on-demand can increase the effectiveness of your reports. Today, we will learn how to do the same in Excel.
Continue »{ 14 Comments }
220 Excel Tips, Tutorials, Templates & Resources for You [Celebrating 20k RSS Members]
Published on Jan 20, 2011 in Charts and Graphs, Learn Excel
![220 Excel Tips, Tutorials, Templates & Resources for You [Celebrating 20k RSS Members]](https://img.chandoo.org/l/220-excel-tips-tricks-templates-resources.png)
I have an exciting news & massive post for you.
Chandoo.org reaches 20,156 RSS Subscriber mark on Jan 19, 2011As of Jan 19, 2011, our little blog has registered our 20,000th RSS Subscriber. While this is not a huge achievement or anything, It certainly calls for celebration. I am so happy to see our mission to make people awesome in Excel is reaching out to more people everyday. Thank you.
To celebrate this milestone, I am doing a massive post with 220 Excel tips, tricks, tutorials & templates.
Formulas [52 tips]
Formatting & Conditional Formatting [36 tips]
Charting [60 tips]
Tables & Pivot Tables [15 tips]
Using Excel [47 tips]
Free Downloads [5 tips]
Recommended Resources [5 tips]

Once you start using Excel to develop systems, budget, forecast and large tables of data you may come across the dilemma of “How do I know this is right” or “How do I truth check this”.
This post will add a tool to your arsenal to help you out.
{ 24 Comments }
Make your data validations dynamic! [quick tip]
Published on Sep 13, 2010 in Excel Howtos
![Make your data validations dynamic! [quick tip]](https://chandoo.org/img/q/dynamic-data-validation-demo.gif)
Ok, since excel school 3rd batch is going to open on 15th, I wasnt going to write anything today. I have slept just 4 hours last night, blame it on work (and that funny video on youtube). But I found 30 minutes free time, so here you go, a quick but delicious tip on making your data validation dynamic.
Dynamic Data Validation?!? What in the name of slice bread and peanut butter is that?
See the demo aside to understand and read on to master the trick.
Continue »
