All articles with 'screencasts' Tag

Yesterday, you learned about Print Areas – a time & paper saving feature of Excel. While print areas are great, you can only set up one print area per sheet. What if you want to print either report or data based on user selection?
In such cases, you can set up dynamic print areas.
That is right. See above demo to understand how it looks. Read on to learn how to set up dynamic print areas.
Continue »Give descriptive titles to your charts for best results

Here is a simple & effective tip on charting.
Give your charts descriptive & bold titles.
How to set up title that are smart & descriptive?
Simple, follow below steps.
- Create the title you want in a cell
- Select the chart title
- Go to formula bar, press = and point to the cell with title
- Press enter.
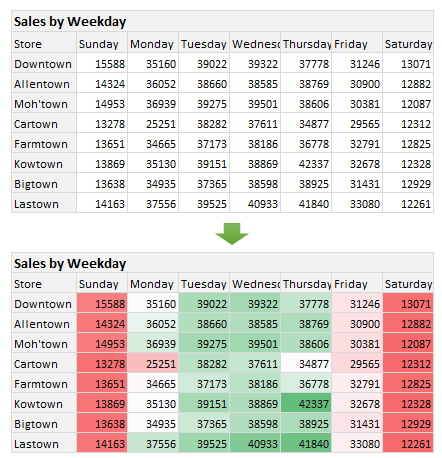
Conditional formatting is one of the most powerful & awesome features of Excel. It is very easy to setup. Naturally, people use it extensively. But the default conditional formatting rules can clutter your reports. Here is one tip that can declutter your reports.
Just show the formatting, not values.
See the above report.
Continue »Remove duplicate combinations in your data [quick tip]
![Remove duplicate combinations in your data [quick tip]](https://chandoo.org/wp/wp-content/uploads/2015/08/remove-duplicate-combinations-v2.gif)
By now, we know how to remove duplicates from data. You can use the Remove Duplicates button to do that.
But do you know that we can use remove duplicates button to get rid off duplicate combinations too?
Remove duplicate combinations – Tutorial
To remove duplicate combinations in your data, just follow below 4 steps:
- Select your data
- Click on Data > Remove Duplicates button
- Make sure all columns are checked
- Click ok and done!
See this demo:
Continue »Quickly filter a table by combination of selected cell values using VBA

Filtering is one of the most used feature in Excel. It is a quick way to take lots of data and narrow down to the subset we want.
But here is one common filtering scenario that is slow as snail.
Imagine you are looking at some sort of sales data (if you can’t imagine, look at the above demo).
Now, you want to filter this list for gender=male, profession=self-employed, product category = chocolates and quantity = 1.
If you use the right click, filter > filter by selected value approach, this will take several clicks.
Wouldn’t it be cool if you can select the entire combination and say filter?
Unfortunately, no such feature exists in Excel.
But you are not aiming to be ordinary in Excel. You are aiming to be awesome in Excel. That means, you don’t take no for answer.
Fortunately, we can quickly write a VBA macro that filters a list by selection. So let’s do that.
Continue »Are you an analyst? Use these 25 shortcuts & tricks to boost your productivity

Analyst’s life is busy. We have to gather data, clean it up, analyze it, dig the stories buried in it, present them, convince our bosses about the truth, gather more evidence, run tests, simulations or scenarios, share more insights, grab a cup of coffee and start all over again with a different problem.
So today let me share with you 25 shortcuts, productivity hacks and tricks to help you be even more awesome.
Continue »
Here is a situation all too familiar.
You are looking at a spreadsheet full of data. You need to analyze and tell a story about it. You have little time. You don’t know where to start.
Today let me share 15 quick, simple & very powerful ways to analyze business data. Ready? Let’s get started.
Continue »Introduction to Slicers – What are they, how to use them, tips, advanced techniques & interactive reports using Excel Slicers

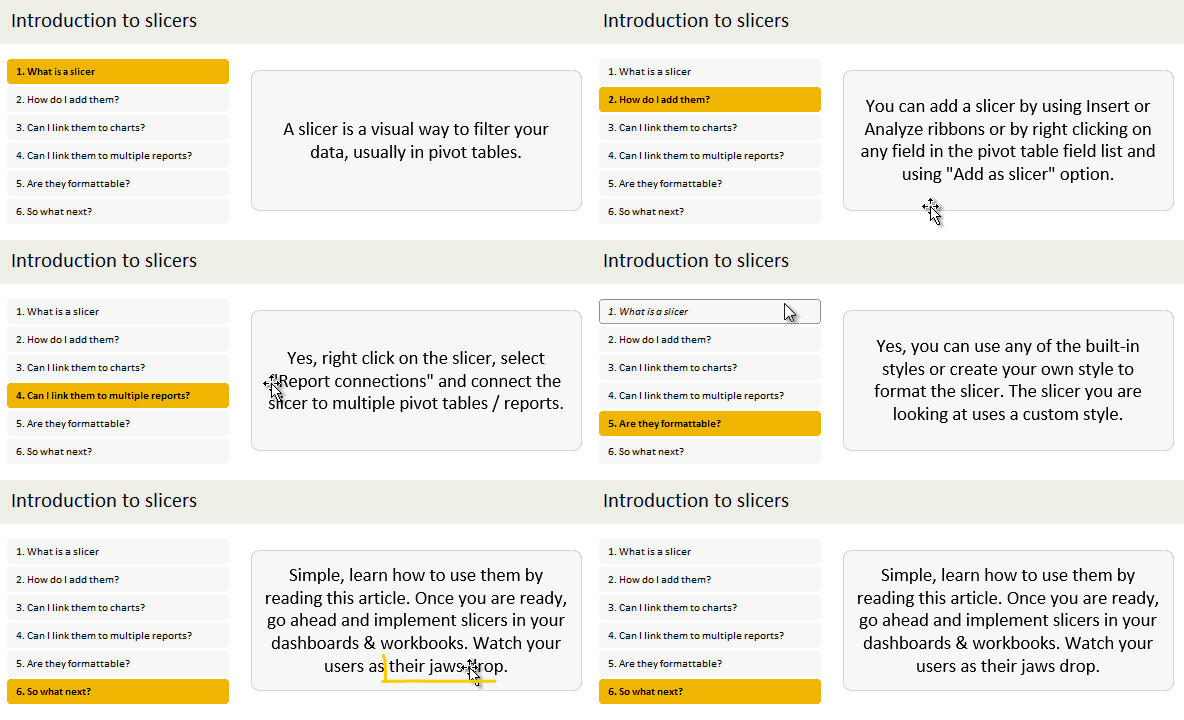
Slicers are one of my favorite feature in Excel. And here is a quick demo to show why they are my favorite.
Slicers – what are they?
Slicers are visual filters. Using a slicer, you can filter your data (or pivot table, pivot chart) by clicking on the type of data you want.
For example, let’s say you are looking at sales by customer profession in a pivot report. And you want to see how the sales are for a particular region. There are 2 options for you do drill down to an individual region level.
- Add region as report filter and filter for the region you want.
- Add a slicer on region and click on the region you want.
With a report filter (or any other filter), you will have to click several times to pick one store. With slicers, it is a matter of simple click.
Read more to learn all about slicers
Continue »Use Paste Special to multiply (or add, divide etc.) a range with a variable [quick tip]
![Use Paste Special to multiply (or add, divide etc.) a range with a variable [quick tip]](https://chandoo.org/wp/wp-content/uploads/2015/06/multiply-formulas-with-paste-special.png)
Here is a fun way to use Paste Special to quickly multiply everything in a range with 1.1 (why 1.1? Well, imagine you have a report with everything in US $s and your boss wants to see the numbers in Australian $s…)
Since your report has different formulas for each cell, you can’t multiply first cell with a rate variable and drag it down. You have to manually edit each formula and add *rate at the end of it.
Oh wait…, you can use Paste Special.
Continue »Ensure cleaner input dates with conditional formatting [quick tip]
![Ensure cleaner input dates with conditional formatting [quick tip]](https://chandoo.org/wp/wp-content/uploads/2015/05/cleaner-dates-demo.gif)
Here is a familiar problem: You create a workbook to track some data. You ask your staff to fill up the data. Almost all the input data is fine, except the date column. Every one types dates in their own format. Here is a fun, simple & powerful way to warn your users when they […]
Continue »Use arrow keys to select small, unreachable chart series [quick tip]
![Use arrow keys to select small, unreachable chart series [quick tip]](https://chandoo.org/wp/wp-content/uploads/2015/04/use-arrow-keys-to-select-chart-elements.gif)
Here is a fairly annoying problem.
Imagine a chart showing both sales & customer data. Sales numbers are large and customer numbers are small. So when you make a chart with both of these, selecting the smaller series (customers) becomes very difficult.
In such cases, you can use arrow keys – as shown above.
Continue »Find and Highlight all blank cells in your data [Excel tips]
![Find and Highlight all blank cells in your data [Excel tips]](https://chandoo.org/wp/wp-content/uploads/2015/04/find-highlight-blank-cells-in-excel.png)
True story:
On Friday (17th April – 2015), I flew from Vizag (my town) to Hyderabad so that I can catch a flight to San Francisco to attend a conference. As I had 10 hours of overlay between the flights in Hyderabad, I checked in to a lounge area so that I can watch some sports, eat food while pretending to do work on my laptop. There was a gentleman sitting in adjacent space doing some work in Excel. As I began to compose few emails, the gentleman in next sitting space asked me what I do for living. Our conversation went like this.
Me: I run a software company
He: Oh, so you must be good with computers
Me: smiles and cringes at the stereotyping
He: What is the formula to select all the blank cells in my Excel data and highlight them in Yellow color
Mind you, he had no idea that I work in Excel. We were 2 random guys in airport lounge watching sports and eating miserable food.
Me: Well, what are you trying to do?
He: You see, I am auditing this data. I need to locate all the blank rows and set them in different color so that my staff can fill up missing information. Right now, I am selecting one row at a time and filling the colors. Is there a one step solution to this problem?
Needless to say, I showed him how to do it faster, which led to an interesting 3 hours at the lounge.
End of true story.
So today, let’s understand how to find & highlight all the blank cells in the data.
Continue »Use apply names to create readable formulas [quick tip]
![Use apply names to create readable formulas [quick tip]](https://chandoo.org/wp/wp-content/uploads/2015/03/apply-names-in-excel-demo.gif)
We all know that using named ranges is a good practice. So you went ahead and created names for every value in your complex workbook. But now, what about those formulas which still refer to cells by their addresses? Here is a quick tip to make your formulas readable by replacing cell addresses with the names in one go.
Use Apply Names feature.
Continue »
A lot of analysts swear strong allegiance to keyboard shortcuts. But when it comes to formatting a spreadsheet, these shortcuts go for a toss as formatting is a mouse-heavy activity.
But we can use a few simple & effective shortcuts to zip through various day to day formatting tasks. Let me share my favorite formatting shortcuts.
Continue »Celebrate Holi with this colorful Excel file

Today is Holi, the festival of colors in India. It is a fun festival where people smear each other with colors, water balloons, tomatoes and sometimes rotten eggs. This year we wanted to play with only water guns, but kids vetoed that idea vehemently. So we ended up driving to my sister-in-law’s place to play with colors (there were no rotten eggs or tomatoes, thankfully).
Let me smear a few colors on you
I would love to splash a jug full of color water on you and say Happy Holi. But the internets have not advanced thus far. So I am going to give you the next best option.
An Excel workbook to play holi
Continue »

