All articles with 'MOD()' Tag
Reshaping your data easily – Case study [Pivot tables FTW]
![Reshaping your data easily – Case study [Pivot tables FTW]](https://chandoo.org/wp/wp-content/uploads/2017/03/show-me-your-nose.jpg)
Late. Jayaram, my uncle is also a teacher. When I was a kid, I used to spend a lot of time with him, learning all sorts of things. He taught me chess, maths and so many life lessons. I remember one such lesson very vividly. One day, he asked me to do something. I did it in a very long way. After seeing me struggle for several minutes, he chipped in and showed me how to do it easily. He then said, “when someone asks you where your nose is, you don’t twist arm around your head. You just point to your nose directly.”
The idea is that when you have a direct, simple way to do something, you should use it.
Nose and pivot tables… how are they connected?
We are coming to the point. Read on for full case study and solution.
Continue »Earth Venus cosmic dance – Animated chart in Excel

Recently I saw an interesting Earth Venus cosmic dance video on Facebook. See the original video below or here.
Although this is not entirely accurate from physics & astronomy perspectives, the dance is a stunning example of patterns that are generated by simple things.
I wanted to recreate this cosmic dance in Excel. How else am I to get my spreadsheet fix on a Saturday?
Here is a quick demo of the final outcome. Read on to learn more about the Earth Venus cosmic dance.
Continue »Make 1,200 dinosaurs in no time with Excel [formulas]
![Make 1,200 dinosaurs in no time with Excel [formulas]](https://chandoo.org/wp/wp-content/uploads/2016/01/Velociraptor-rs.png)
It seems spreadsheets & dinosaurs on a collision course. How else can you explain Jon’s XKCD Velociraptor problem solved with Excel and now this. Debby, alert reader of our blog sent me this email yesterday.
Continue »I need an algebraic formula to solve this in Excel
I have 5 heads, 5 bodies, 4 arm sets, 4 leg sets and 3 tails. I need to see if I can create 1000 dinosaurs from these, and if that’s too many AND I need the 5 digit groupings to prove it and create them.
basically Xa*Xb*Xc*Xd*Xe=1000 – I’m not supposed to go over 1200. […] And then I want the 5 digit combinations if possible – right now they are trying to do the combinations by hand – would be awesome if we could do it in Excel.
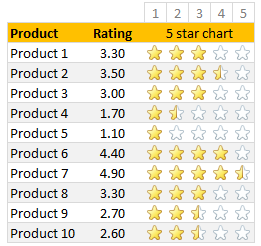
In-cell 5 star chart – tutorial & template

Whenever we talk about product ratings & customer satisfaction, 5 star ratings come to our mind. Today, let’s learn how to create a simple & elegant 5 star in-cell chart in Excel. Something like above.
Read on to learn how to create the above chart.
Continue »Calculating Billy’s total working hours [solution & discussion]
Few days ago, I asked you “How many hours did Billy work?” There were more than 100 responses with lots of innovative solutions.
So today, let’s examine various ways to calculate total working hours given start & end times of tasks. Please watch below video.
Calculating Bill’s total working hours (video)
Continue »Looking up when data won’t play nice – few more alternatives

Recently, we discussed about the case of unwieldy data and how we lookup what we want using formulas like SUMIFS. Today, let us learn few more ways to solve the same problem.
Suitable structure spawns simple solutions
Poorly structured is the 2nd biggest problem of analysts. The first one is not enough coffee. That is why there is a dictum in the data analytics world.
Structure is everything
So, we can easily solve our lookup problem, if our data were to magically re-arranged in 2 column fashion – Data & Value.
Continue »
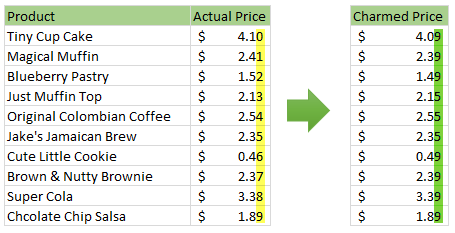
Here is a charming little problem to kick start your day.
Lets say you run a cute little bakery around the corner. Since you want your prices to look charming, you have a policy to round them down or up based on below rule.
If the price ends with 0, 1 or 2 cents, round it down to 9 cents.
If the price ends with 3, 4 or 5 cents, round it up to 5 cents.
If the price ends with 6, 7, 8 or 9 cents, round it up to 9 cents.
For example,
So how do you round to nearest charmed price? You could do it manually. But you would rather bake a few more of those Tiny Cup Cakes than waste time rounding the prices. So you want an automatic way to round prices. This is where Excel helps.
Continue »Mapping relationships between people using interactive network chart

Today, lets learn how to create an interesting chart. This, called as network chart helps us visualize relationships between various people.
Demo of interactive network chart in Excel
First take a look at what we are trying to build.
Looks interesting? Then read on to learn how to create this.
Continue »Calculating average of every nth value [Formula tips]
![Calculating average of every nth value [Formula tips]](https://img.chandoo.org/f/average-of-every-nth-value-excel-formulas.png)
Lets say you have a large list of numbers, and you want to calculate the average of every nth value. Not the average of all numbers, but just every nth number.
That is what we will learn in next few minutes.
Continue »
Is my number a Prime Number?
What is a Prime Number?
Today in Formula Forensics we answer both questions.
Continue »
How can we Add Up the Odd numbers between 1 and 100 ?
Continue »
Zebra Stripes and Checker Boards
This week in Formula Forensics I’m taking a break from Array Formulas to have a look at some Zebra Stripes and Checker Boards.
No, I haven’t gone crazy, although some may argue that point.
More specifically were going to take a look at, Zebra Stripes and Checker-Board Conditional Formatting.
Continue »
.

.

.

.

.

.

.
This is the Forth post in Chandoo’s, Formula Forensics series.
Last week Luke showed us how to extract a sorted list according to a criteria from a larger list
and he analysed a formula to solve this problem
This week we look at Fred’s Problem…
How do I simplify a very long formula?
Continue »Mod() function in excel to Implement Escalation Frequency [Financial Modeling Tutorials]
![Mod() function in excel to Implement Escalation Frequency [Financial Modeling Tutorials]](https://chandoo.org/wp/wp-content/uploads/2011/04/EscalationFrequency.gif)
You take an apartment on rent at $1000 per month and the owner puts an escalation clause saying 10% increment each 3 years. How do you model this in excel? In this tutorial we understand how escalations at certain frequency can be implemented using the mod function in excel. What is the mod() function Simply […]
Continue »How to Filter Odd or Even Rows only? [Quick Tips]
![How to Filter Odd or Even Rows only? [Quick Tips]](https://chandoo.org/img/q/filtering-odd-or-even-rows-excel-howto-th.png)
Ashish sends out this SOS thru email, “I need your help in putting filters . Can we filter the cells on the basis of their even or odd character. i.e in the table of 1-1000, i wish to filter, 1,3,5,7,…”
An odd request, I must say. But nevertheless, possible in Excel.
Read this quick tip, If you want know how to filter odd or even rows only in a list of values.
Continue »

