All articles with 'INDEX()' Tag
{ 4 Comments }
Office 2010 Contest Winners are here!!!
Published on Jun 25, 2010 in blogging, Excel Howtos

Okay folks, sorry I took quite awhile to post this. But I was busy with excel school and getting my kids buzz cut. So here you go. Contest winners – India Paresh shah (website) Abhishek Jain Rahul Mulchandani (website) Contest winner – International Tom (this Tom) Congratulations Winners. You will very soon hear from me […]
Continue »{ 76 Comments }
Automatic Rolling Months in Excel [Formulas]
Published on Apr 6, 2010 in Excel Howtos, Learn Excel
![Automatic Rolling Months in Excel [Formulas]](https://chandoo.org/img/f/dynamic-starting-month-demo.gif)
Often when we are making spreadsheets for forecasting or planning we would like to keep the starting month dynamic so that rest of the months in the plan can automatically rolled. Don’t understand? See this example: This type of setup is quite useful as it lets us change the starting month very easily. We can […]
Continue »![How to Visualize Survey Results using Incell Panel Charts [case study]](https://chandoo.org/img/cb/survey-results-panel-chart-example.png)
A panel chart (often called as trellis display or small-multiples) shows data for multiple variables in an easy to digest format. It lets users compare in any way and draw conclusions with ease.
Today, I want to discuss how the principles of panel chart can be applied to visualize a complex set of survey results. For this we will use the recent survey conducted by Gartner on how various customers use BI (Business Intelligence) tools.
Continue »{ 31 Comments }
Flu Trends Chart in Excel [Yes, we can edition]
Published on Jan 22, 2010 in Charts and Graphs, Featured
![Flu Trends Chart in Excel [Yes, we can edition]](https://chandoo.org/img/p/flu-trends-chart-final-th.png)
Last week I have reviewed Google’s flu trends chart and told you that is it is very well made. Out of curiosity I made a similar chart in Excel. In this post, I am going to share the experience and results with you. Interested? Read on…
Continue »{ 30 Comments }
Reverse a List using Formulas [Using Excel INDEX() Formula]
Published on Nov 19, 2009 in Excel Howtos, Learn Excel
![Reverse a List using Formulas [Using Excel INDEX() Formula]](https://chandoo.org/img/l/reverse-list-in-excel.png)
Here is a simple yet novel use of formulas. Let us say you have a list of values in range A1:A5 and you want to reverse the list. In an empty cell write =INDEX($A$1:$A$5,6-ROWS($A$1:A1)) and copy down. Boom, you get the reversed list. Here is how the formula works: In the reversed list, first item […]
Continue »{ 4 Comments }
Product Recommendation – Excel Lookup Toolbox
Published on Nov 5, 2009 in Learn Excel, products
Anyone working on the data using excel will know the importance of lookup formulas. They are vital for making almost any spreadsheet or dashboard. That is why when my friend John Franco, who maintains Excel-Spreadsheet-Authors.com, wrote to me about his new book Excel lookup toolbox I was truly excited. In this post I am going to share my review of this product.
Continue »{ 25 Comments }
Recipe for a Donut Bar Chart
Published on Sep 30, 2009 in Charts and Graphs, Learn Excel
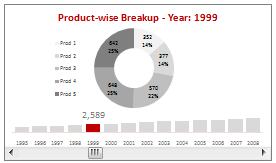
We all know that bar charts can be used to display values spread across various categories or times and pie charts / donut charts can be used to display percentage breakup of various quantities in a sum total. How about mashing up both to create a Donut Bar chart?
In this tutorial, you can learn how to make a donut bar chart and linking it to a form control to display Product-wise sales breakups spread across several years.
Continue »It is no exaggeration that knowing excel formulas can give you a career boost. From someone starting at the long list of numbers, you can suddenly become a data god who can lookup, manipulate and analyze any spreadsheet.
So when our little excel blog hit the 5000 RSS Subscriber milestone, I celebrated the occasion by asking you to share an excel formula through twitter or comments with rest of us. And boy, what an excellent list of formula tips you have shared with us all.
Here is the complete list of entries for the twitter formula contest.
{ 17 Comments }
Generating invoice numbers using excel [reader questions]
Published on Jul 20, 2009 in Excel Howtos, Learn Excel
![Generating invoice numbers using excel [reader questions]](https://chandoo.org/img/l/invoice-numbers.gif)
Learn how to generate invoice numbers, tax codes etc. using Microsoft Excel. In this example we will take a real life example shared by Michelle and findout how we can generate invoice numbers using excel formulas. Read more to learn and download the example workbook.
Continue »{ 31 Comments }
How to Round and Sort Data using Excel Formulas?
Published on Jul 6, 2009 in Excel Howtos, Learn Excel

Cheryl asks via e-mail, “I was wondering if you could help me figure out how to combine the round formula with the rank formula? I need to first round all the numbers and then rank them.”
Of course we can solve this by simply using array formulas. Curious? Find out more by reading the rest of this post.
Continue »{ 21 Comments }
Incell Dot Plots in Microsoft Excel
Published on Jun 10, 2009 in Charts and Graphs, Learn Excel

Dot plots are a very popular and effective charts. According to wikipedia “Dot plots are one of the simplest plots available, and are suitable for small to moderate sized data sets. They are useful for highlighting clusters and gaps, as well as outliers.”
Today we will learn about creating in-cell dot plots using excel. We will see how we can create a dot plot using 3 data series of some fictitious data.
Continue »Today is our last installment of your week @ PHD. We have some exciting tips on using VBA, date formulas and index-match syntax.
Continue »{ 4 Comments }
Excel Tips Submitted by You [Part 2]
Published on May 12, 2009 in Charts and Graphs, Learn Excel
In today’s installment of “your week @ PHD” we will learn how to use array formulas to refine text search, a bunch of very useful keyboard shortcuts, and a very simple tip on how to get ready when you want to make a chart. All really juicy tips, so read on.
Continue »
Today we will learn a little trick to compare 1 value with a set of values, For eg. our sales vs. competitor sales. We will learn how to create a chart like this.
Continue »
