All articles with 'hyperlink()' Tag
Hello everyone. Stop reading further and go fetch your helmet. Because what lies ahead is mind-blowingly awesome.
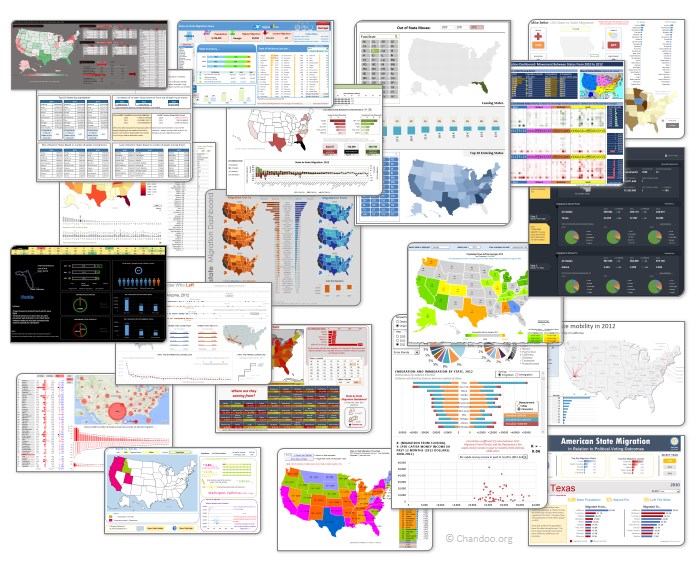
About a month and half ago, we held our annual dashboard contest. This time the theme is to visualize state to state migration in USA. You can find the contest data-set & details here.
We received 49 outstanding entries for this. Most of the entries are truly inspiring. They are loaded with powerful analysis, stunning visualizations, amazing display of Excel skill and design finesse. It took me almost 2 weeks to process the results and present them here.
Click on the image to see the entries.
Continue »Excel Links – Lets meet in Chennai this Sunday edition
Hi readers… I am in Chennai this week, conducting in-house training at Renault Nissan on Advanced Excel. As I am busy teaching Excel & making young graduates awesome in it, I will not be able to write much on the blog. But don’t worry. We have some great articles coming up from Hui & other […]
Continue »
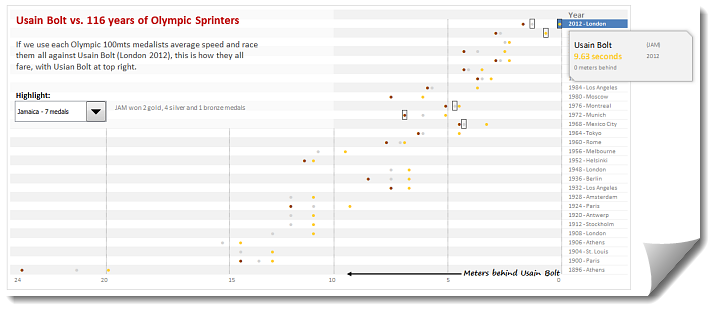
During London 2012 Olympics, Usain Bolt reached the 100mts finish line faster than anyone in just 9.63 seconds. Most of us would be still reading this paragraph before Mr. Bolt finished the race.
To put this in perspective, NY Times created a highly entertaining interactive visualization. Go ahead and check it out. I am sure you will love it.
So I wanted to create something similar in Excel. And here is what I came up with.
Continue »![Making your dashboards interactive [Dashboard Essentials]](https://img.chandoo.org/vp/grammy-bump-chart-replication-in-excel-demo.gif)
Everyone likes to be in control. Even my 2 year old daughter jumps with joy when she lays her hands on TV remote. She pushes the buttons and assumes it is working. It is another story that we rarely watch TV at home.
By adding an element of control, we can make our dashboard reports fun. Interactive elements like form controls, slicers etc. invite users to play with your dashboard, get involved and understand data by asking questions. That is why I recommend making dashboards interactive.
Today lets understand how you can make dashboards interactive.
Continue »10 Excel Keyboard Shortcuts I can’t live without!

Everyone and their colleague knows the importance of Excel keyboard shortcuts. While it may be a good idea to know a 97 different shortcuts for everything in Excel, the fact is, you don’t use them all the time. So, it all boils down to memorizing the few shortcuts that you use all the time.
In this post, I am sharing 10 such shortcuts that I can’t live without, especially, when I am analyzing data, making charts and formatting my workbooks.
Continue »Video Tutorial on Interactive Dashboard using Hyperlinks
Few days ago, we published an article on how to create interactive dashboards using hyperlinks. Many of you loved this tutorial. But quite a few of you also said, this tutorial is a bit complex to follow.
So, I made a short video explaining how the UDF and interactive hyperlinks work and how our dashboard is weaved together.
Continue »
Last week we learned how to create dynamic hyperlinks in Excel. Today, I want to show you something even cooler. An interactive dashboard based on hyperlinks, like shown above.
Isn’t it impressive?
Well, to create something like this, you don’t need a degree in advanced cryogenics. You just need a bunch of data, a chart, a one line macro code and some pixie dust (go easy on pixie dust).
Continue »Create Dynamic Hyperlinks in Excel [Video]
![Create Dynamic Hyperlinks in Excel [Video]](https://img.chandoo.org/q/dynamic-hyperlink-in-excel.png)
During one my recent training programs, a participant asked an interesting question.
I have a list of values. I would like to place a hyperlink in my workbook that would always take me to the last value in the list.
Something like shown aside.
Click on the image to learn how this is done.
Continue »An Excel Dashboard to Visualize 10,007 Comments [Dashboard Tutorial]
![An Excel Dashboard to Visualize 10,007 Comments [Dashboard Tutorial]](https://chandoo.org/img/vp/10007-comments-dashboard-thumb.png)
First some good news, On 21st November, 2010, our little blog received its 10,000th comment!
Thank you so much for making this happen.
Those of you reading chandoo.org for a while know my penchant for comments. I have learned a lot of excel tips & ideas just by reading the comments you posted on this blog. I think comments are one of the best parts of this blog. So, naturally, I wanted to celebrate this milestone, with something big & awesome.
My intention was to download all the 10,000+ comments and play with the data to come up with something outstanding, like a dashboard. It took me 2 days to conceptualize and create this beauty.
Continue »How to make a Birthday Reminder in Excel ? [Video]
Learn how to create a birthday reminder worksheet in excel in this video post. You can also download a template to keep track of upcoming birthdays and anniversaries.
Continue »


