All articles with 'howto' Tag
{ 41 Comments }
What is camera tool and how to use it? [spreadcheats]
Published on Dec 2, 2008 in Charts and Graphs, Learn Excel
![What is camera tool and how to use it? [spreadcheats]](https://img.chandoo.org/excel-camera-tool-thumb.png)
Camera tool is your way of creating visual reference in an excel sheet. It is one of the useful and hidden features of excel. Here is how it works. You specify a rectangular area in your workbook and camera tool creates a mirror image of that area as a drawing object. You can move it or resize it. And whenever the contents of original rectangular area changes (charts, drawings or cell values) the mirror image changes too.
Continue »{ 113 Comments }
Advanced Data Validation Techniques in Excel [spreadcheats]
Published on Nov 25, 2008 in Learn Excel
![Advanced Data Validation Techniques in Excel [spreadcheats]](https://chandoo.org/wp/wp-content/uploads/2008/11/data-validation-change-lists.png)
Data validation is a great way to keep your users informed about possible values in a cell and guide them to select something appropriate. As part of the spreadcheats series, in this post we will discuss 2 advanced data validation techniques that can help you when you are modeling a complex worksheet.
Continue »
Often when you are writing code or testing an application, it might be helpful to have random phone numbers generated for you. Here is an excel formula that I use: =value(left(substitute(rand(),”0.”,””),10)) try these 2 instead (thanks to John) =RAND()*(9999999999-1000000000)+1000000000 =RANDBETWEEN(1000000000,9999999999) [needs analysis toolpack add-in or excel 2007] Even though it works most of the time […]
Continue »{ 2 Comments }
Make your VBA macros work anywhere: Enable Relative References
Published on Nov 18, 2008 in Learn Excel

Do you know that while recording macros in excel you can use the relative reference based recording so that you can use your macro anywhere and the references would be adjusted automatically? Yes! I have learned this yesterday and I thought it is pretty cool. Here is how you can make your macro VBA code […]
Continue »{ 17 Comments }
Seperating digits from a number [excel formulas]
Published on Nov 14, 2008 in Learn Excel
![Seperating digits from a number [excel formulas]](https://chandoo.org/wp/wp-content/uploads/2008/11/dividing-number-to-digits-excel-formula.png)
Reader Joann asks through email: Take the number 117490. I need to break it down5 times: 11749 1174 117 11 1 You can use FLOOR() function to get the desired result, like this: =FLOOR(your-number/10^digit-no,1) See the image below:
Continue »{ 18 Comments }
How to present changes in Market Share using Charts?
Published on Nov 14, 2008 in Charts and Graphs, Learn Excel
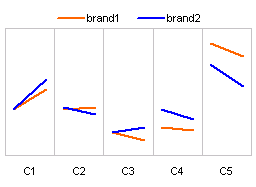
Most of us are comfortable with numbers, but we are confused when it comes to convert the numbers to charts. We struggle finding the right size, color and type of charts for our numbers. The challenge is two fold, we want to make the charts look good (we mean, really… really good) but at the […]
Continue »{ 85 Comments }
Eight ways to exploit COUNTIF() … and sumif() too [spreadcheats]
Published on Nov 12, 2008 in Learn Excel
![Eight ways to exploit COUNTIF() … and sumif() too [spreadcheats]](https://chandoo.org/wp/wp-content/uploads/2008/11/using-countif-excel-help.png)
If for every countif() I write excel paid me a dollar, I would be a millionaire by now. It is such a versatile and fun formula to work with that I have decided to write about it as third post in our spreadcheats series. Using COUNTIF() to replace pivot tables: We all know that you […]
Continue »{ 11 Comments }
Excel Formula for Finding Repeated Words in a Cell
Published on Nov 11, 2008 in Learn Excel

If you ever need to know whether a particular word is repeated in a cell (for eg: a file extension or telephone number or name of the customer) here is how you can find it. =if(lower(cell-with-text)<>SUBSTITUTE(lower(cell-with-text),lower(word-to-check),””,2),”Yes”,”No”) We are using substitute() to replace the second occurance of a particular word and then compare this with original […]
Continue »{ 18 Comments }
Extracting Unique, Duplicate and Missing Items using Formulas [spreadcheats]
Published on Nov 6, 2008 in Analytics, Learn Excel
![Extracting Unique, Duplicate and Missing Items using Formulas [spreadcheats]](https://chandoo.org/wp/wp-content/uploads/2008/11/duplicate-items-excel-formula-find.gif)
Often I wish Microsoft had spent the effort and time on a data genie (and a set of powerful formulas) that can automate common data cleanup tasks like extracting duplicates, makings lists unique, find missing items, remove spaces etc. Alas, instead they have provided features like clippy which are intrusive to say the least. So […]
Continue »
Yesterday I have learned this cool excel charting trick and I cant wait to share it with you all. The problem: I have too many charts & want to show one based on selection You have made 3 charts to show your company performance in the last 8 years. But you don’t want to clutter […]
Continue »{ 30 Comments }
Relative vs. Absolute References in Formulas [spreadcheats]
Published on Nov 4, 2008 in Learn Excel
![Relative vs. Absolute References in Formulas [spreadcheats]](https://chandoo.org/wp/wp-content/uploads/2008/11/excel-relative-formula-references.gif)
This is the first installment of the spreadcheats series. I have used excel an year and half before I learned about the relative and absolute references. It was such a joyous feeling to find out that you can actually write one (or just a few) formulas and use the power of auto-fill to do the […]
Continue »![Adding Box Plots to Show Data Distribution in Dashboards [Part 6 of 6]](https://chandoo.org/wp/wp-content/uploads/2008/10/box-plot-excel-dashboard-visualization-thumb.png)
This is a Guest Post by Robert on Visualization Techniques for Excel KPI Dashboards. This 6 Part Tutorial on Management Dashboards Teaches YOU: Creating a Scrollable List View in Dashboard Add Ability to Sort on Any KPI to the Dashboard Highlight KPIs Based on Percentile Add Microcharts to KPI Dashboards Compare 2 KPIs in the […]
Continue »{ 1 Comment }
Sports Statistics Dashboard in Excel – Few More Alternatives
Published on Oct 24, 2008 in Charts and Graphs, Learn Excel

First of all, thanks everyone for making the should you always start barcharts at zero? discussion lively. Almost everyone felt that we should start bar charts at zero. After spending sometime with my initial test cricket statistics dashboard, I have created few alternatives. You can see them below. But somehow I feel that I haven’t […]
Continue »
Sorting text is such a day to day activity that it always surprises me why Excel hasn’t provided a simple spreadsheet formula for doing it. Of course you can use the sorting menu command (menu > data > sort) but this requires manual steps (or VBA). Most of the times we get raw textual data […]
Continue »{ 20 Comments }
Sports Dashboards in Excel – A Tutorial
Published on Oct 20, 2008 in Charts and Graphs, Learn Excel

One of my favorite cricket player, the GOD – Sachin Tendulkar has become highest test run scorer. What do I get if Sachin becomes highest scorer, you may ask. In order to celebrate this occasion I have created a cool sports dashboard in excel with some of the top test cricket players’ statistics. And, you […]
Continue »
