All articles with 'howto' Tag
{ 253 Comments }
VLOOKUP(), MATCH() and INDEX() – explained in plain English
Published on Feb 11, 2024 in Featured, Learn Excel

VLOOKUP may not make you tall, rich and famous, but learning it can certainly give you wings. It makes you to connect two different tabular lists and saves a ton of time. In my opinion understanding VLOOKUP, INDEX and MATCH worksheet formulas can transform you from normal excel user to a data processing beast. Today, […]
Continue »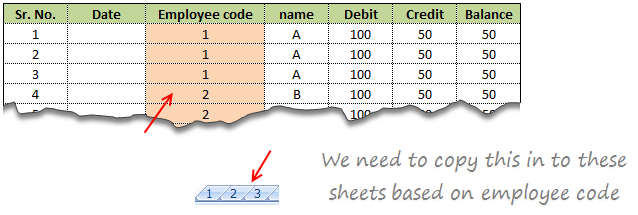
Suresh sent an email with interesting problem.
There is one data entry sheet where all the data needs will be entered, however once done we want the data to be stored separately in multiple sheets designated by the Employee code.
In this article we will learn how to use VBA to help in resolving the problem Suresh was facing at work.
Continue »{ 57 Comments }
Using an Array Formula to Find and Count the Maximum Text Occurrences in a Range
Published on Oct 31, 2011 in Excel Howtos, excel links, Formula Forensics, Huis, Learn Excel, Posts by Hui

Chandoo is off on Holidays and once again thrown me the keys to Chandoo.org.
So this week we’re going to:
- Pull apart an Array Formula and see what’s under the hood;
- Have a look at a technique for quickly developing Custom Number Formats &
- Look at how we can use HTML Codes in posts at Chandoo.org to spice up your questions and answers.
Today is Tarun’s Problem
“I have got multiple names in each row and would like to have what name is repeated maximum number of times and how many times?”
Today we pull apart an answer to this question and see how it works.
Continue »
Learn how to use excel chart templates in this installment of spreadcheats. Save time.
Continue »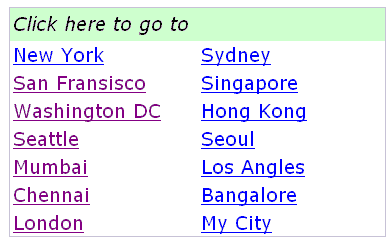
Learn how to create Table of Contents in Excel and other tricks to manage when you have too many worksheets.
Continue »{ 24 Comments }
Employee Satisfaction Surveys using MS Excel
Published on Feb 4, 2009 in Excel Howtos, Learn Excel

Today we will learn how to make an employee satisfaction survey and consolidate the data using excel.
Continue »Hurray, PHD blog crossed 2000 RSS Subscriber base. This is a very significant milestone for me.
To celebrate this occasion we have a mega post: 100 Excel & Charting Tips, Tricks and Resources for you.
Continue »{ 78 Comments }
How to Hide Worksheet Tabs in Excel Workbook
Published on Jan 22, 2009 in Excel Howtos, Learn Excel

Excel trick to prevent users from un-hiding “hidden sheets” in an excel file.
Continue »{ 25 Comments }
Sales Funnel Charts in Excel – Tutorial
Published on Jan 9, 2009 in Charts and Graphs, Learn Excel
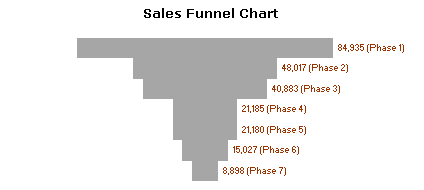
Sales funnel is a very common business chart. Here is a simple bar chart based trick you can use to generate a good funnel chart to be included in that project report.
Continue »{ 175 Comments }
Automatically insert timestamps in excel sheet using formulas
Published on Jan 8, 2009 in Learn Excel

Often when you use excel to track a particular item (like expenses, exercise schedules, investments) you usually enter the current date (and time). This is nothing but timestamping. Once the item is time stamped, it is much more easier to analyze it. Here is an excel formula trick to generate timestamps.
Continue »{ 59 Comments }
Excel Basics – What are Combination Charts and How to Make One?
Published on Jan 5, 2009 in Charts and Graphs, Learn Excel
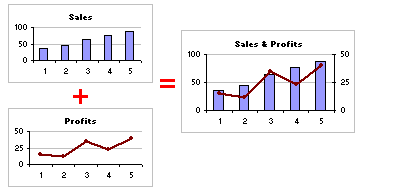
A combination chart is when you combine two different charts to make one. A popular example for combination chart is a line & bar graph combination.
Continue »{ 0 Comments }
Selecting all the cells in a series – keyboard and mouse shortcuts [spreadcheats]
Published on Dec 30, 2008 in Learn Excel
![Selecting all the cells in a series – keyboard and mouse shortcuts [spreadcheats]](https://img.chandoo.org/select-a-series-of-cells.png)
Here is a very quick spreadcheat for the new year.
If you need to select all the cells in a series (either row-wise or or in columns) you can use one of these 2 shortcuts (and avoid unnecessary scrolling)
1. Select the first cell in the series
2. Press Shift + Ctrl + Down arrow
Or
1. Select the first cell in the series
2. Hold down SHIFT and Double click on the edge of cell in the direction you want to select
Continue »{ 11 Comments }
Use Alt+Enter to get multiple lines in a cell [spreadcheats]
Published on Dec 19, 2008 in Learn Excel
![Use Alt+Enter to get multiple lines in a cell [spreadcheats]](https://chandoo.org/wp/wp-content/uploads/2008/12/line-break-excel-howto.png)
A very quick spreadcheat for Friday. If you need to type content in a cell and you want to see it multiple lines then use alt + enter to break the content in several lines. See to the right for an example.
Bonus tip: If you are using formulas to create content in a cell by combining various text values and you want to introduce line breaks at certain points … For eg. you are creating an address field by combining house number, street name, city and zip code and you want to introduce line breaks after house number and street name then you can use CHAR(10).
Continue »{ 24 Comments }
Custom Views in Excel – Save filter and header settings for quick reference
Published on Dec 17, 2008 in Learn Excel

PHD reader and commenter Vishy contributed this post through e-mail. Thank you so much Vishy for this very useful tip. The Problem: You have created a specific view of your data in Excel (say by filtering, zooming out, changing column width, hiding specific rows, customizing window settings, print settings etc.). This is your reference point […]
Continue »{ 6 Comments }
Brick Charts in Excel – an Alternative to Gridlines
Published on Dec 10, 2008 in Charts and Graphs, Learn Excel
Grid lines provide great help in understanding values in a chart. Here is a handy trick you can use in the next bar chart to spice it up. Here is how you can get this type of chart (we will call it a brick chart) First we will make a regular bar chart Now, let […]
Continue »
