All articles with 'howto' Tag
{ 16 Comments }
Use Enter to Paste Copied Values in Excel [Quick Tip]
Published on Oct 17, 2008 in Learn Excel
![Use Enter to Paste Copied Values in Excel [Quick Tip]](https://chandoo.org/wp/wp-content/uploads/2008/10/copy-paste-tip-excel.png)
Here is a simple copy pasting tip. Next time when you want to paste a set of copied cells to another area, instead of using CTRL+V, just use ENTER. See this: Learn 16 more excel copy pasting tricks today.
Continue »{ 32 Comments }
15 MS Excel Tips to Make you a Productivity Guru
Published on Oct 16, 2008 in Featured, Learn Excel
We all like to customize things, to personalize them so that we feel better, faster and smarter using them. Microsoft Excel is a perfect example of highly customizable software. It is simple to learn and use, and at the same time it is relatively easy to change the way it works for you. Here is […]
Continue »{ 34 Comments }
More than 3 Conditional Formats in Excel
Published on Oct 14, 2008 in Charts and Graphs, Learn Excel

One of the most popular posts on this blog is how to become excel conditional formatting rock star. Quite a few commenters there asked me if there is a way to get more than 3 (or 4) conditional formats in excel 2003. Like what you see below: You can get more than three conditional formats […]
Continue »{ 13 Comments }
Display decimals only when the number is less than 1 [Excel number formatting tip]
Published on Oct 2, 2008 in Learn Excel
![Display decimals only when the number is less than 1 [Excel number formatting tip]](https://chandoo.org/wp/wp-content/uploads/2008/10/number-formatting-tip-conditionally-showing-decimals.png)
Here is a quick excel number formatting tip. If you ever want to format numbers in such a way that it shows decimal values only if the number is less than 1 you can use conditional custom cell formatting (do not confuse with conditional formatting). Here is an example: In such cases you can use […]
Continue »{ 21 Comments }
Simple Todo List application using Excel – Download and become productive
Published on Oct 1, 2008 in Learn Excel

After seeing Andrew’s simple excel based check-list I got this idea of preparing a simple To-Do list application using excel. Since most of us use Excel on day to day basis, why not use it as a productivity application as well by keeping track of all the things we must do (TO DO List). When […]
Continue »{ 66 Comments }
Clean up Incorrectly Formatted Phone Numbers using Excel
Published on Sep 30, 2008 in ideas, Learn Excel

In our Utopian imaginations all the data would have been standardized and shareable across systems and people. But alas, the reality is totally different. We seldom get data in the format / way we desire it to be. In other words, the ingredients are all there, but for us to prepare the dinner, you must […]
Continue »
Spelling mistakes are a thing of day to day carporate life. Most of the data in spreadsheets is entered by people and hence prone to having spelling mistakes or alternate spellings. For eg. a person named John could have been spelled as Jon. And when John calls you back to confirm his reservation and you […]
Continue »
Often when you are working on 2 incompatible systems and try to import data from one to another, excel can be a handy tool. I have used excel plenty of times to generate SQL insert / update statements which I could later execute on the database console. Here is a tutorial if you ever have […]
Continue »{ 17 Comments }
Visualization Challenge – How to show market share changes?
Published on Sep 18, 2008 in Charts and Graphs, Learn Excel
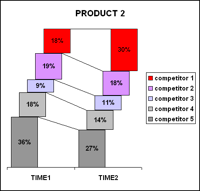
One of our readers Jennifer mailed me with this excel charting problem she is having. I thought why not ask other readers for their advice on this. So here it goes: The Charting Challenge – Visualizing Changes in Market Share Here is an excerpt from her email: The gist of my problem is how to […]
Continue »{ 16 Comments }
Calculating Paydays in a calendar year using Excel
Published on Sep 17, 2008 in america, Learn Excel

In India salary is usually paid on the last working day of a month – the payday. It is slightly different in countries where payrolls are processed every 2 weeks. For eg. in US most companies pay salary on every 2nd Friday / Thursday. We can calculate the paydays / payroll periods in excel with […]
Continue »
By integrating services like Google Finance, Search in to spreadsheet functions, google docs has paved the way for endless possibilities. Google spreadsheet function GoogleFinance() can be used to build stock portfolio tracker sheet that can fetch historical stock quotes to tell how your money is doing. Click here to see the stock portfolio tracker sheet […]
Continue »Creating KPI Dashboards in Microsoft Excel is a series of 6 posts by Robert from Munich, Germany. This 6 Part Tutorial on KPI Dashboards Teaches YOU: Creating a Scrollable List View in Dashboard Add Ability to Sort on Any KPI to the Dashboard Highlight KPIs Based on Percentile Add Microcharts to KPI Dashboards Compare 2 […]
Continue »![Creating KPI Dashboards in Microsoft Excel [Part 1 of 6]](https://chandoo.org/wp/wp-content/uploads/2008/08/kpi-dashboard-scroll-excel-thumb.png)
Creating KPI Dashboards in Microsoft Excel is a series of 6 posts by Robert. This 6 Part Tutorial on KPI Dashboards Teaches YOU: Creating a Scrollable List View in Dashboard Add Ability to Sort on Any KPI to the Dashboard Highlight KPIs Based on Percentile Add Microcharts to KPI Dashboards Compare 2 KPIs in the […]
Continue »{ 118 Comments }
Bingo / Housie Ticket Generator in Excel
Published on Jul 16, 2008 in Analytics, Learn Excel

I am fascinated by board games. They provide immense fun, anyone can enjoy them, they are unpredictable and best of all they are great value for money. That is why whenever I get sometime I experiment with simulating games to know them better. So, out of curiosity I have created an excel sheet that can generate bingo / housie (housey) tickets – 24 of them at a time. To get new set of tickets you would hit F9 (recalculate).
Continue »
I can never get tired of in-cell charts, whenever I get sometime, I try to experiment something on them. Here is an idea to design true incell column charts without using any add-ins or installing fonts. These charts can be fun to have on your project report or annual news letter or memos, they take […]
Continue »
